Luis A. Mateos
layer Edge applied to NBA 1990-1991 to 2015-2016

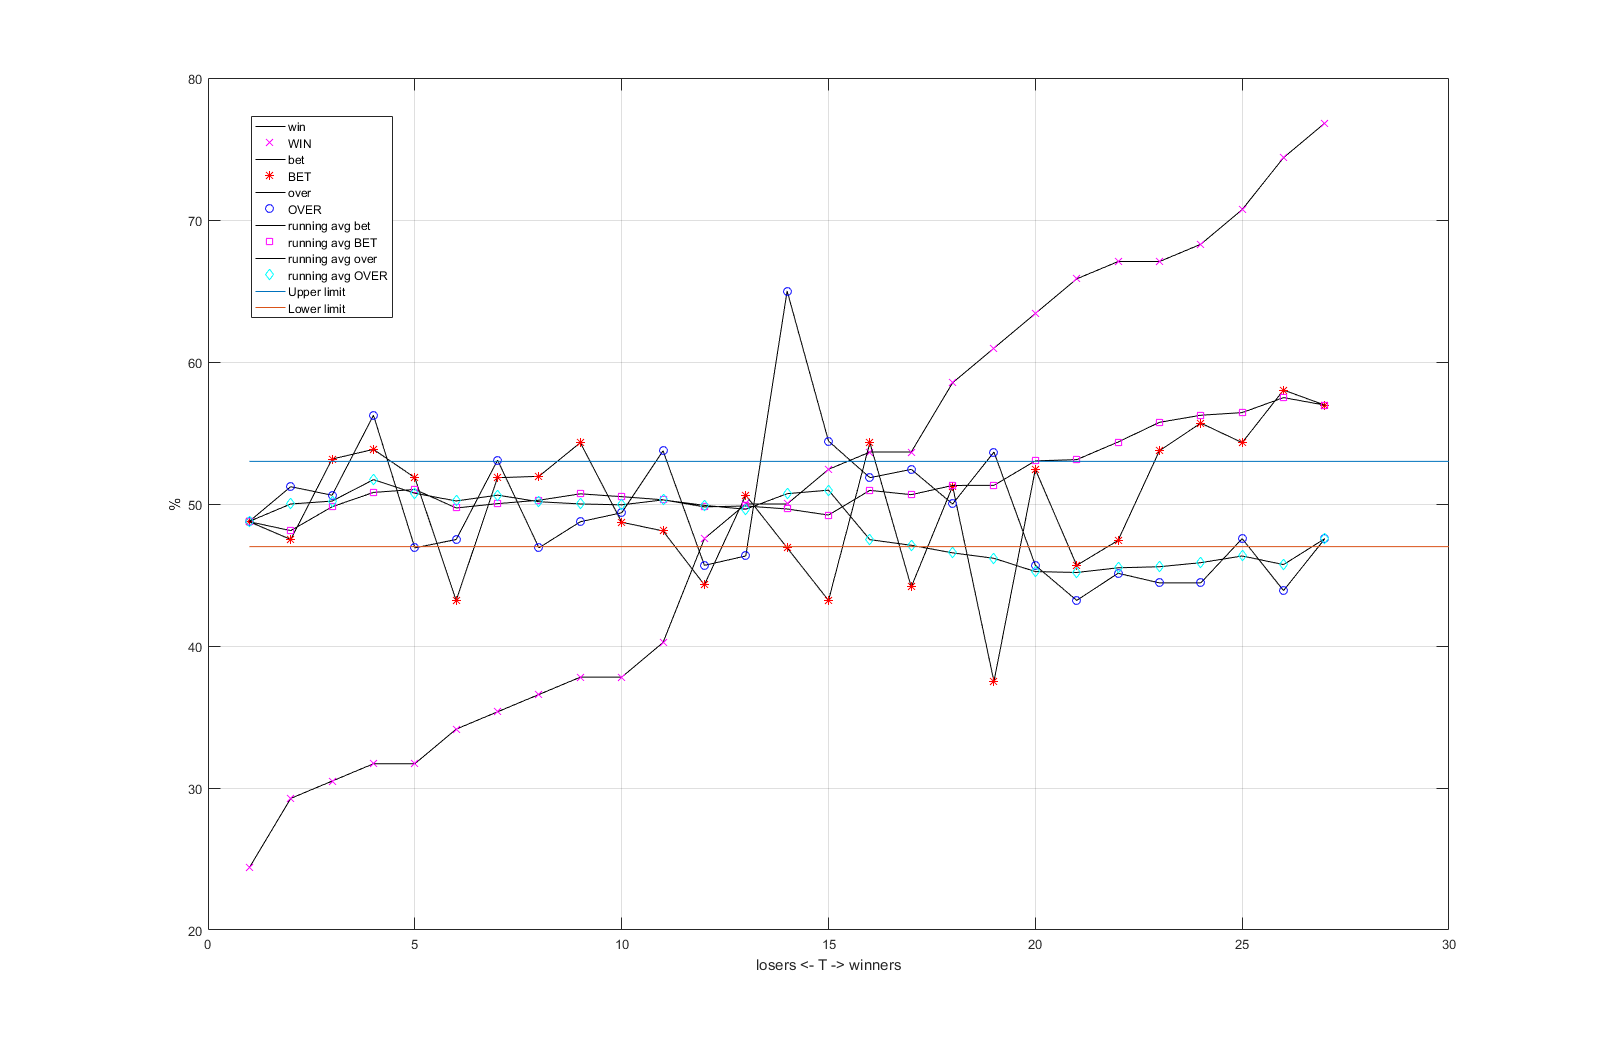
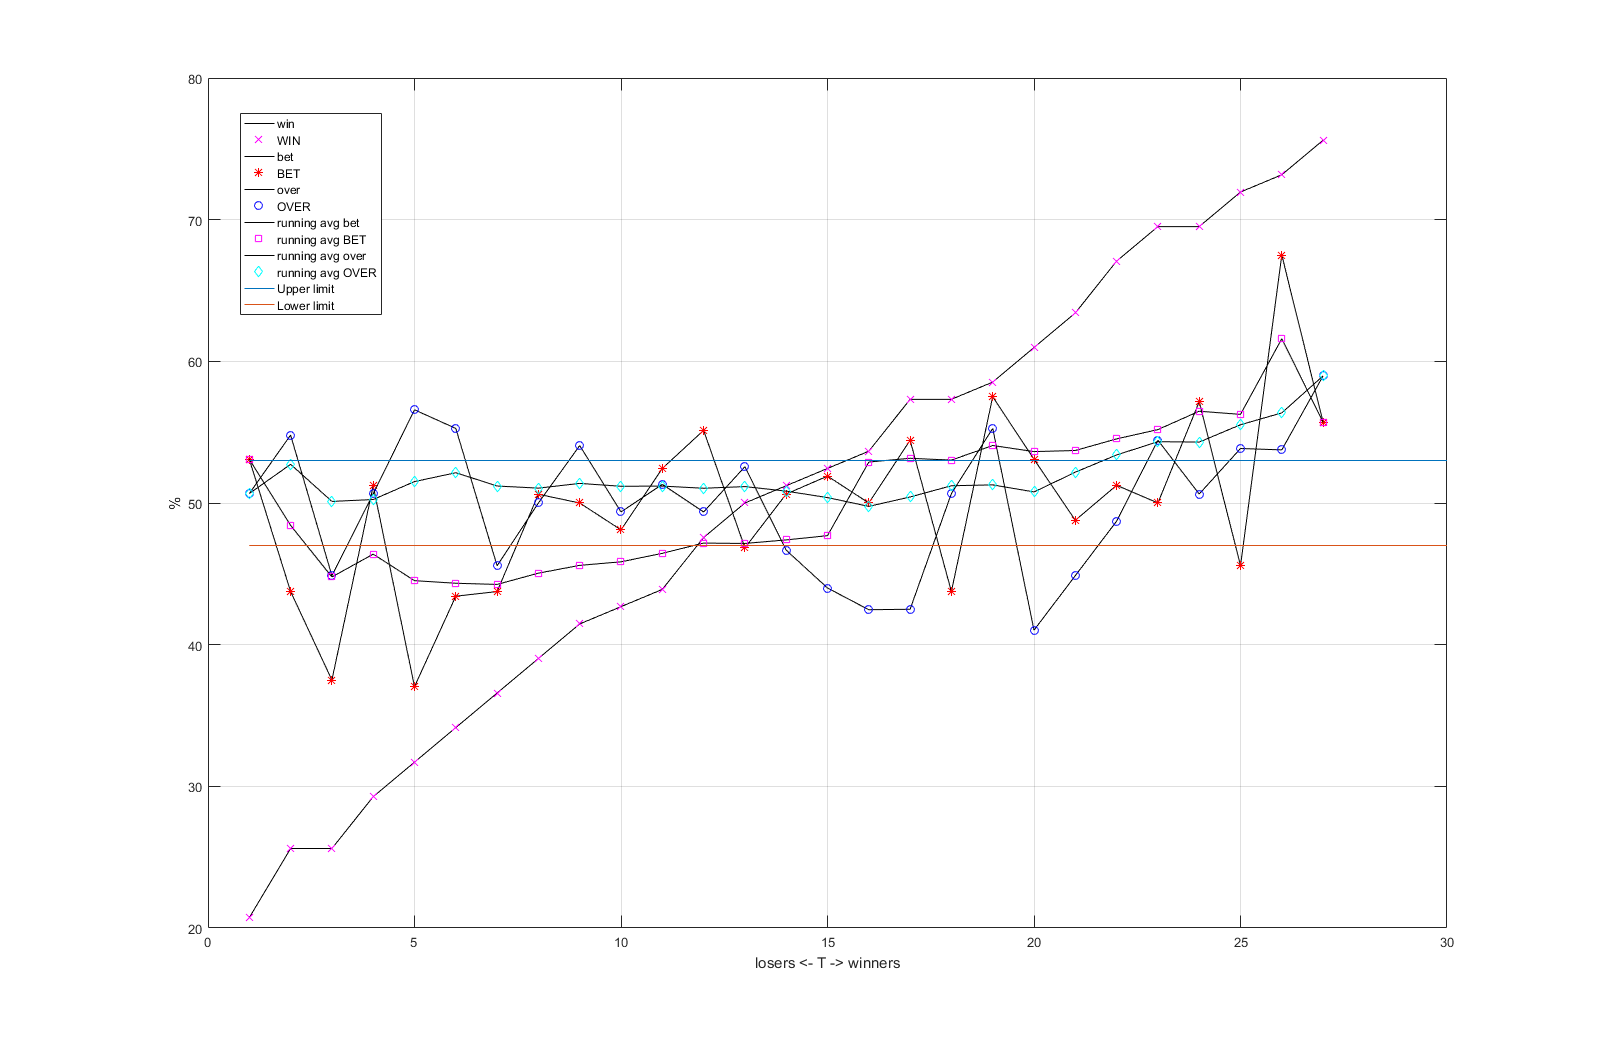
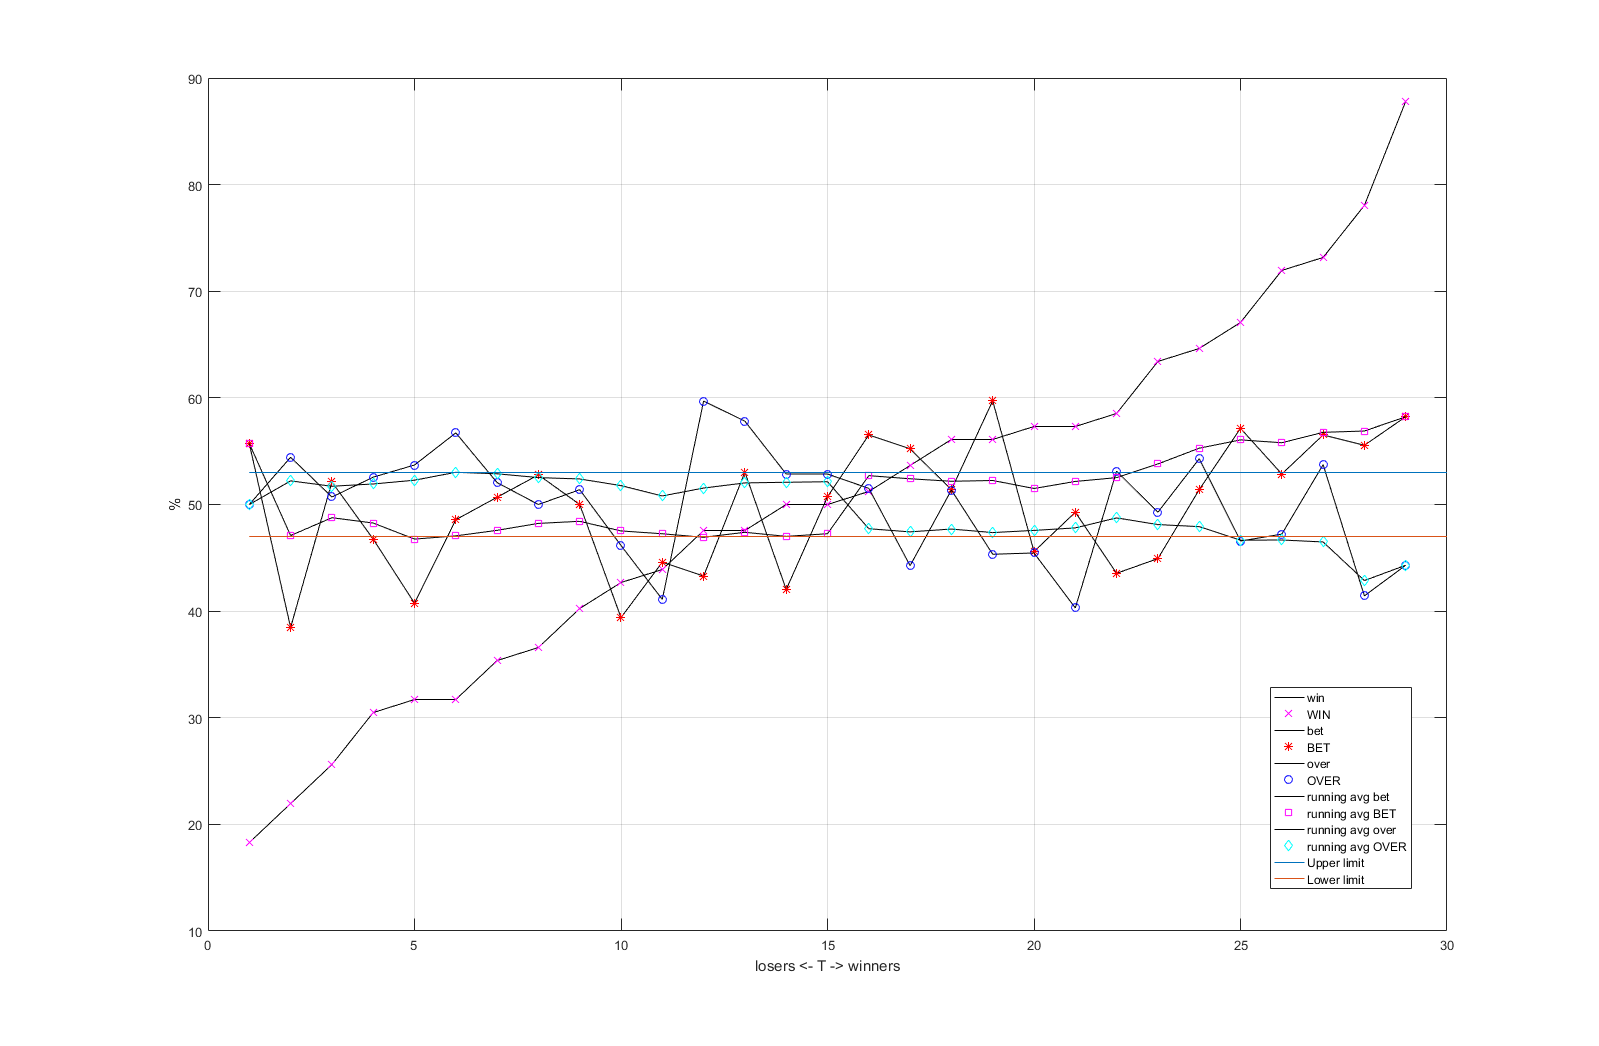
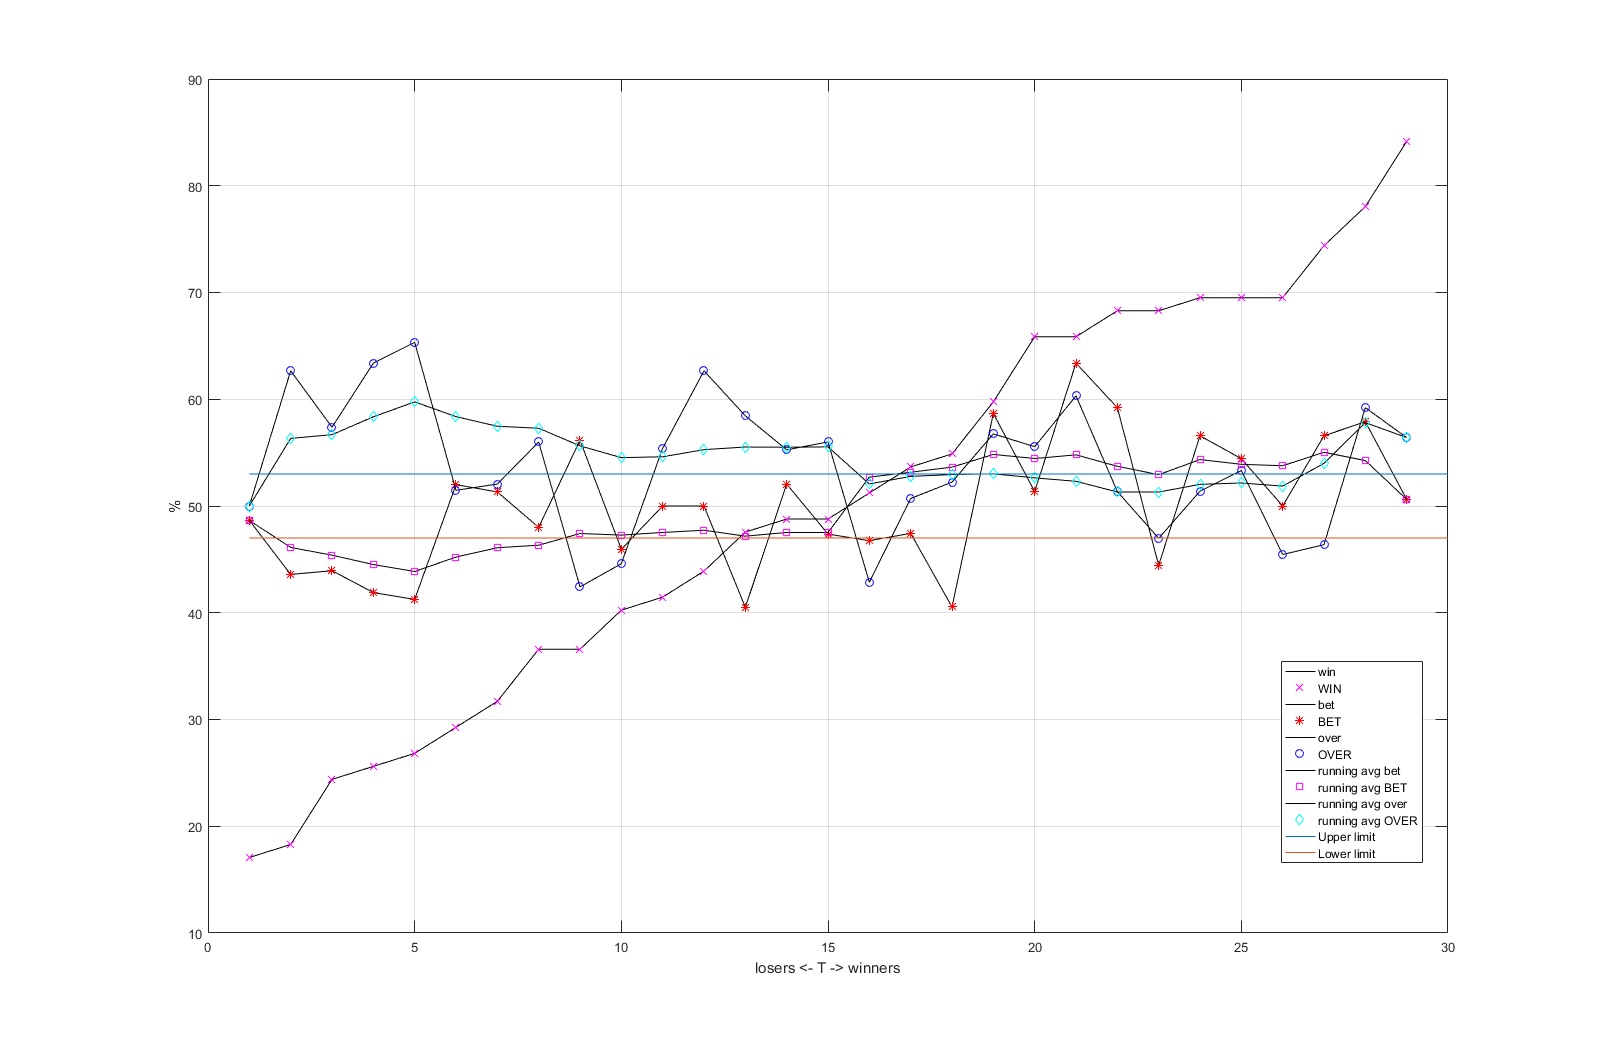
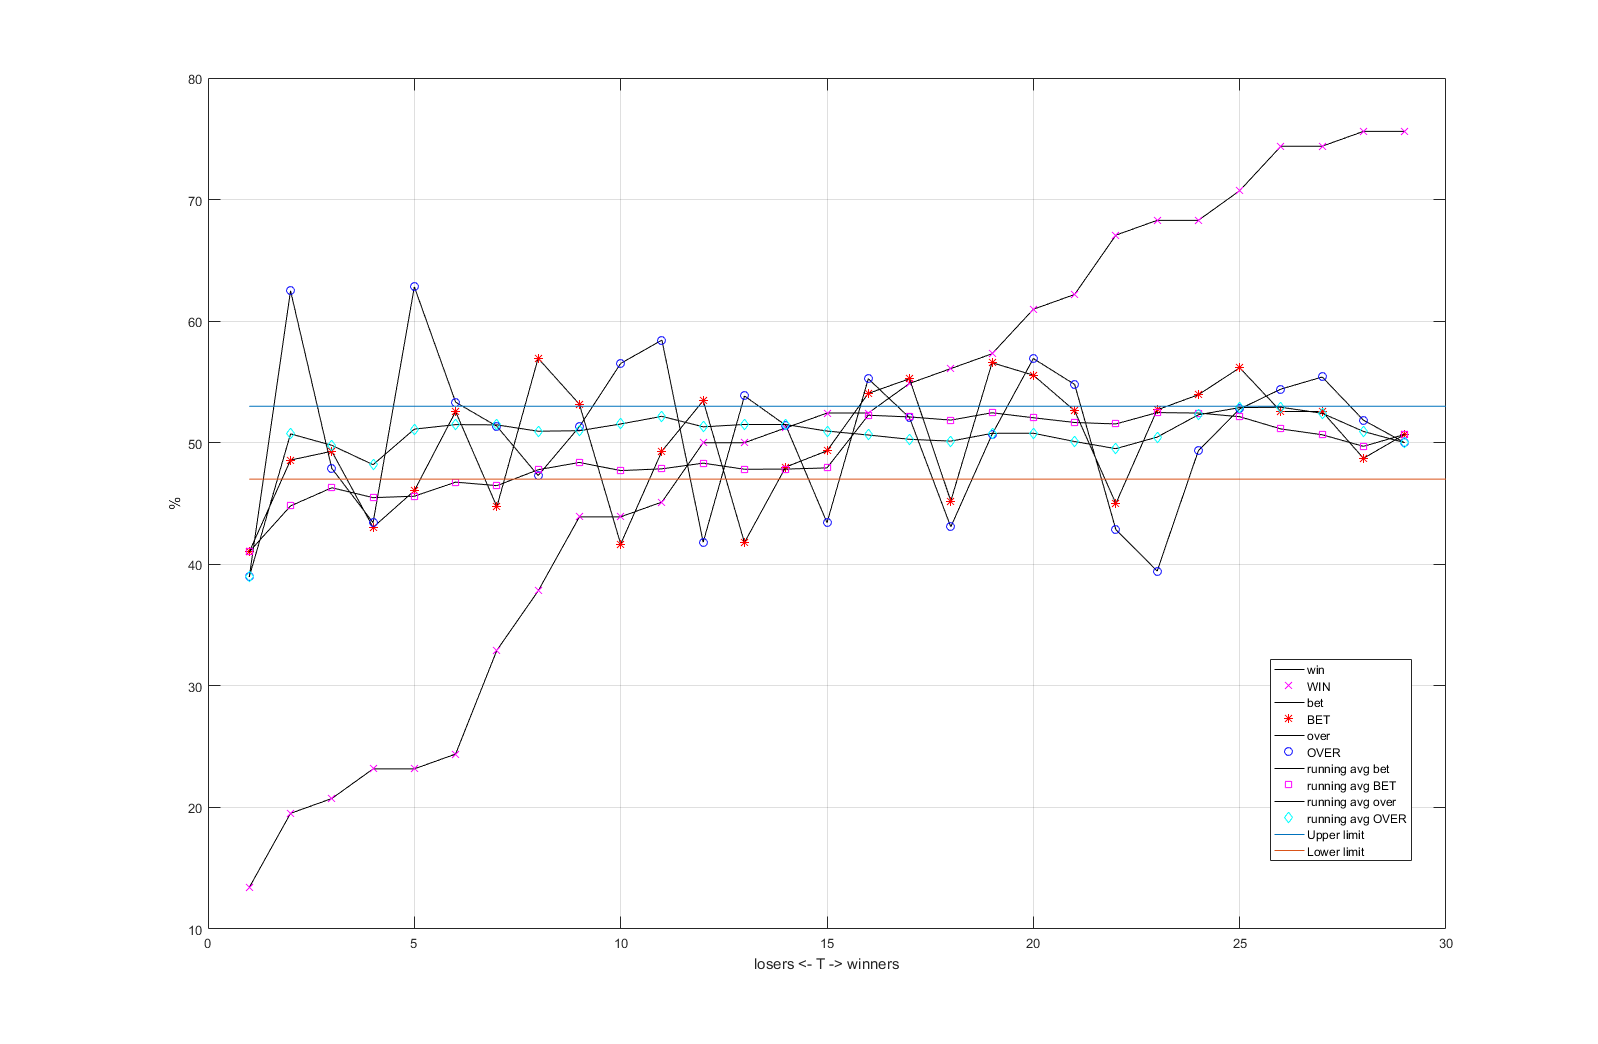
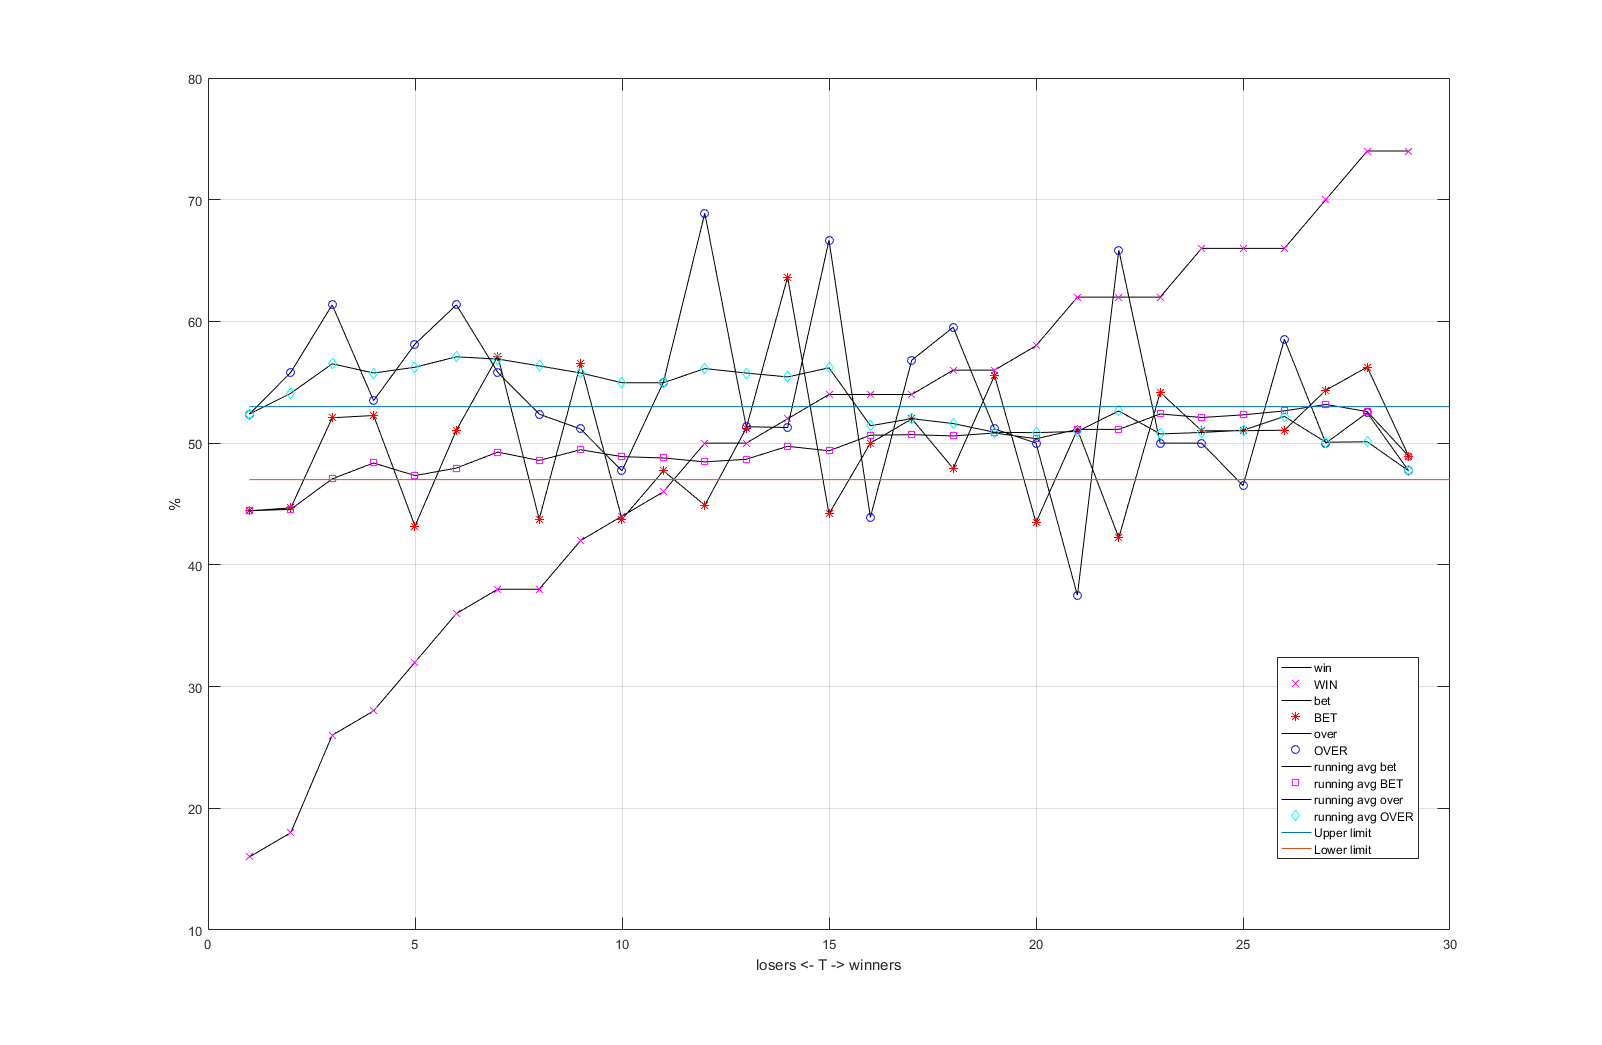
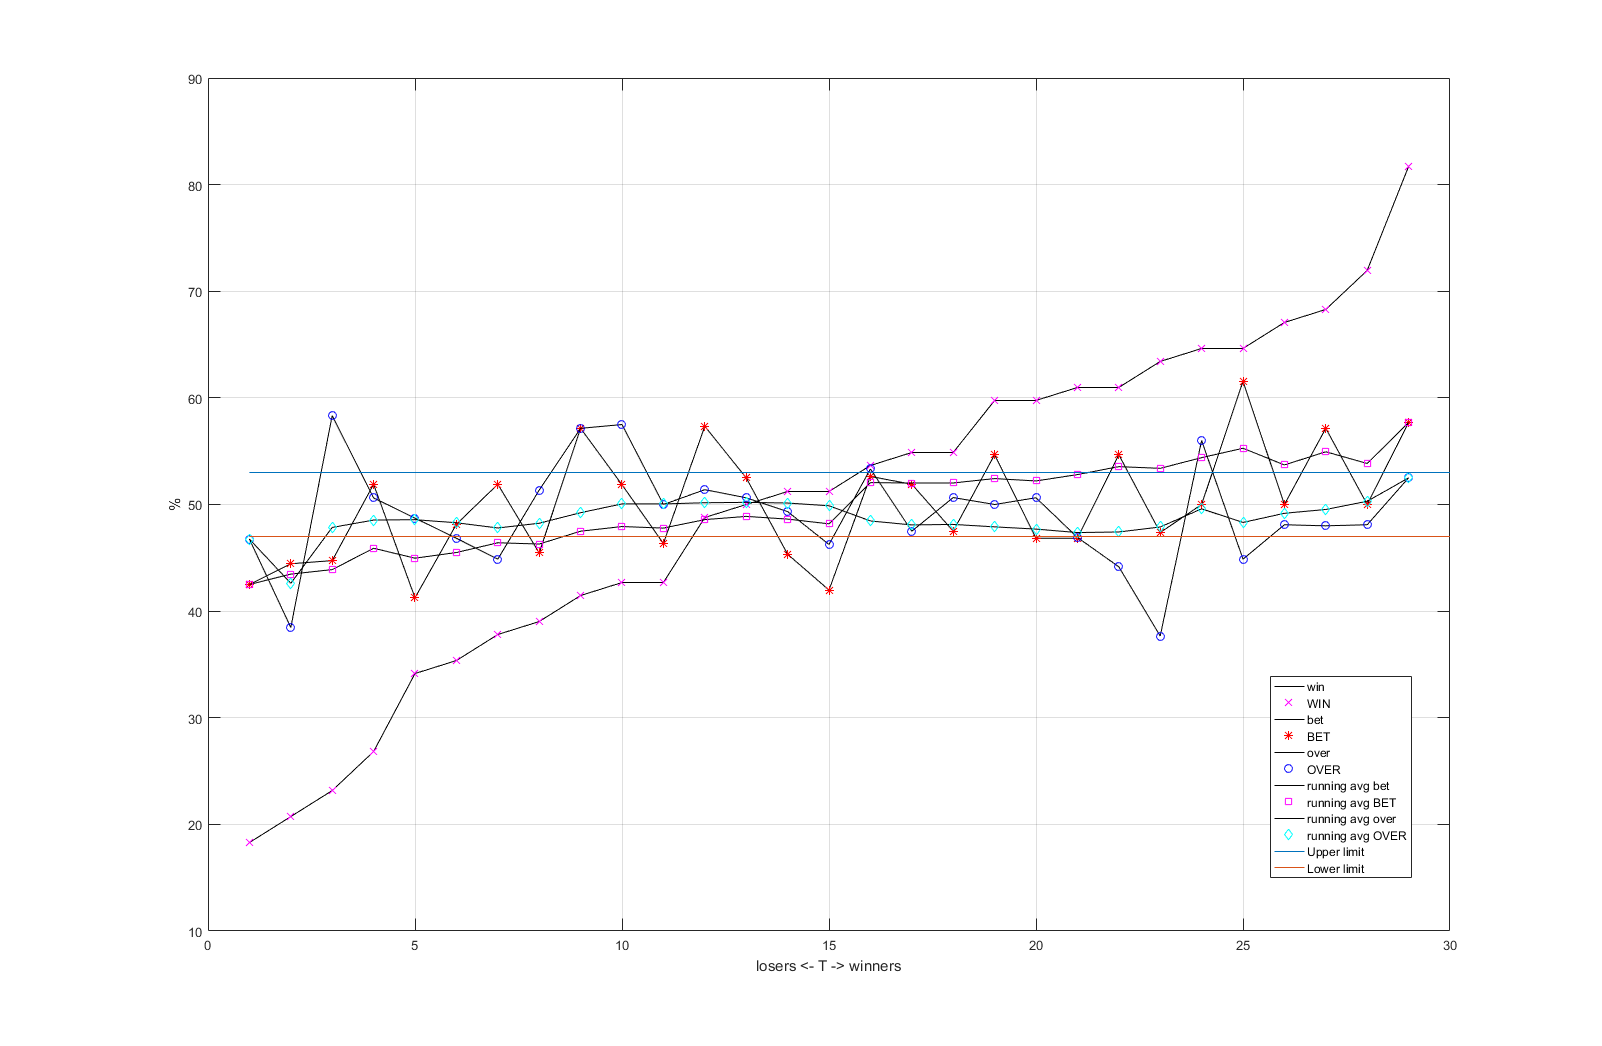
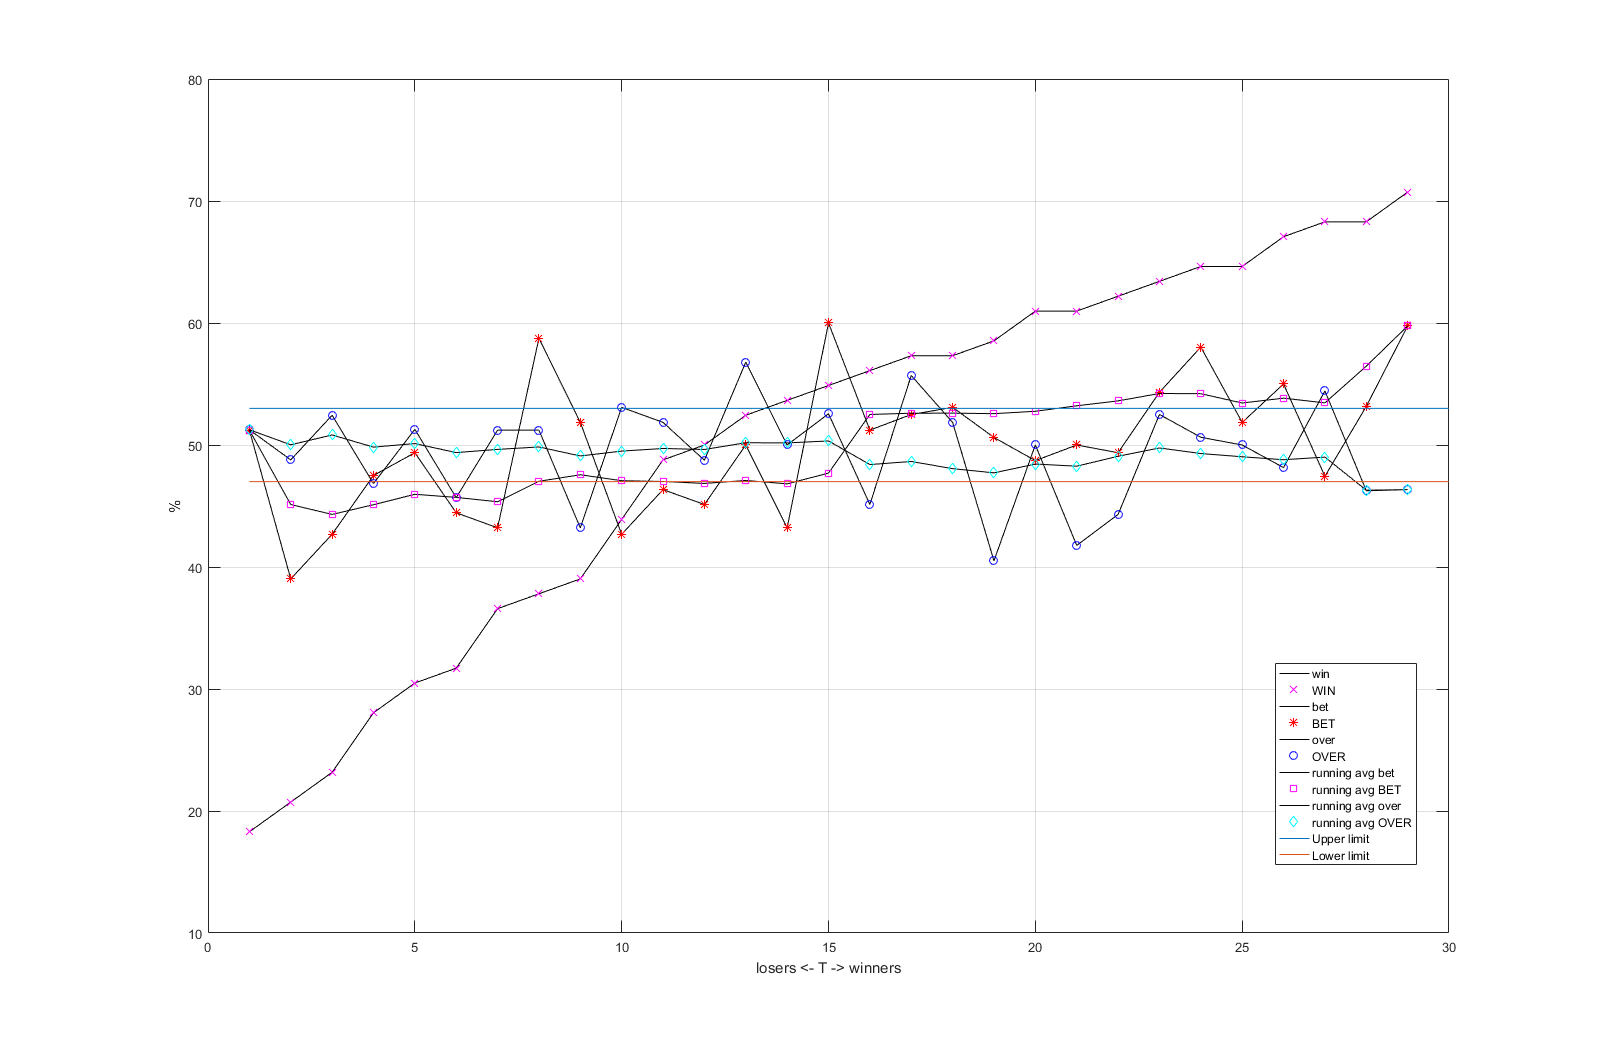
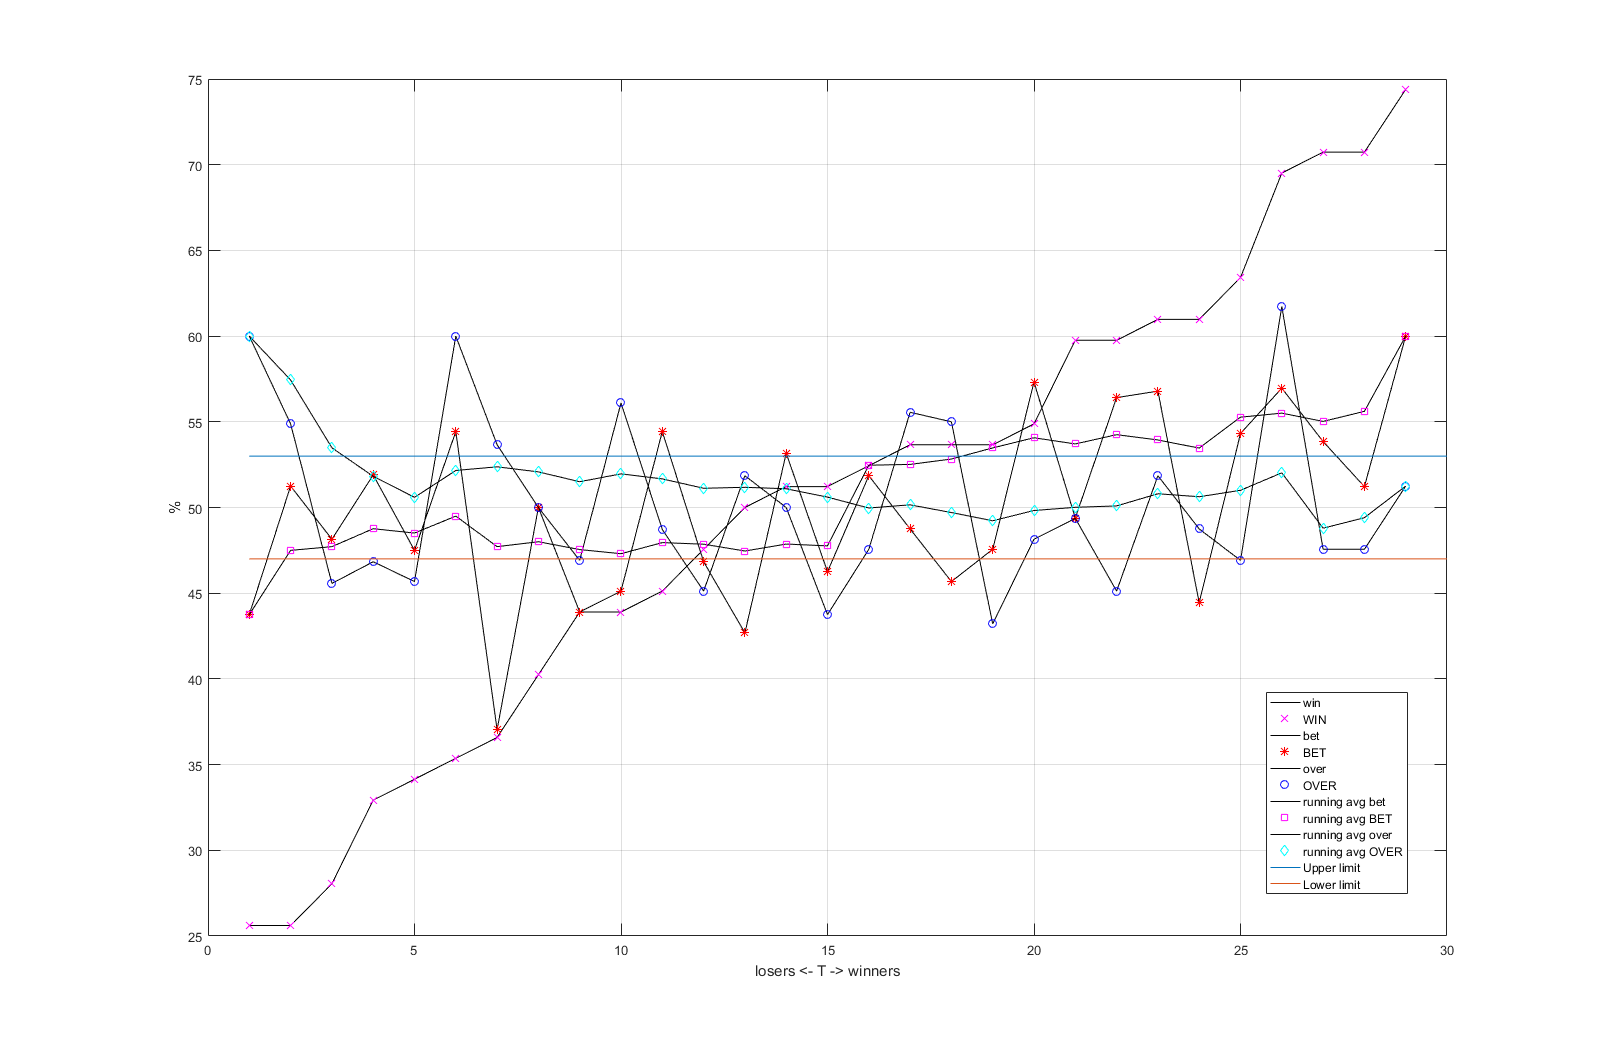
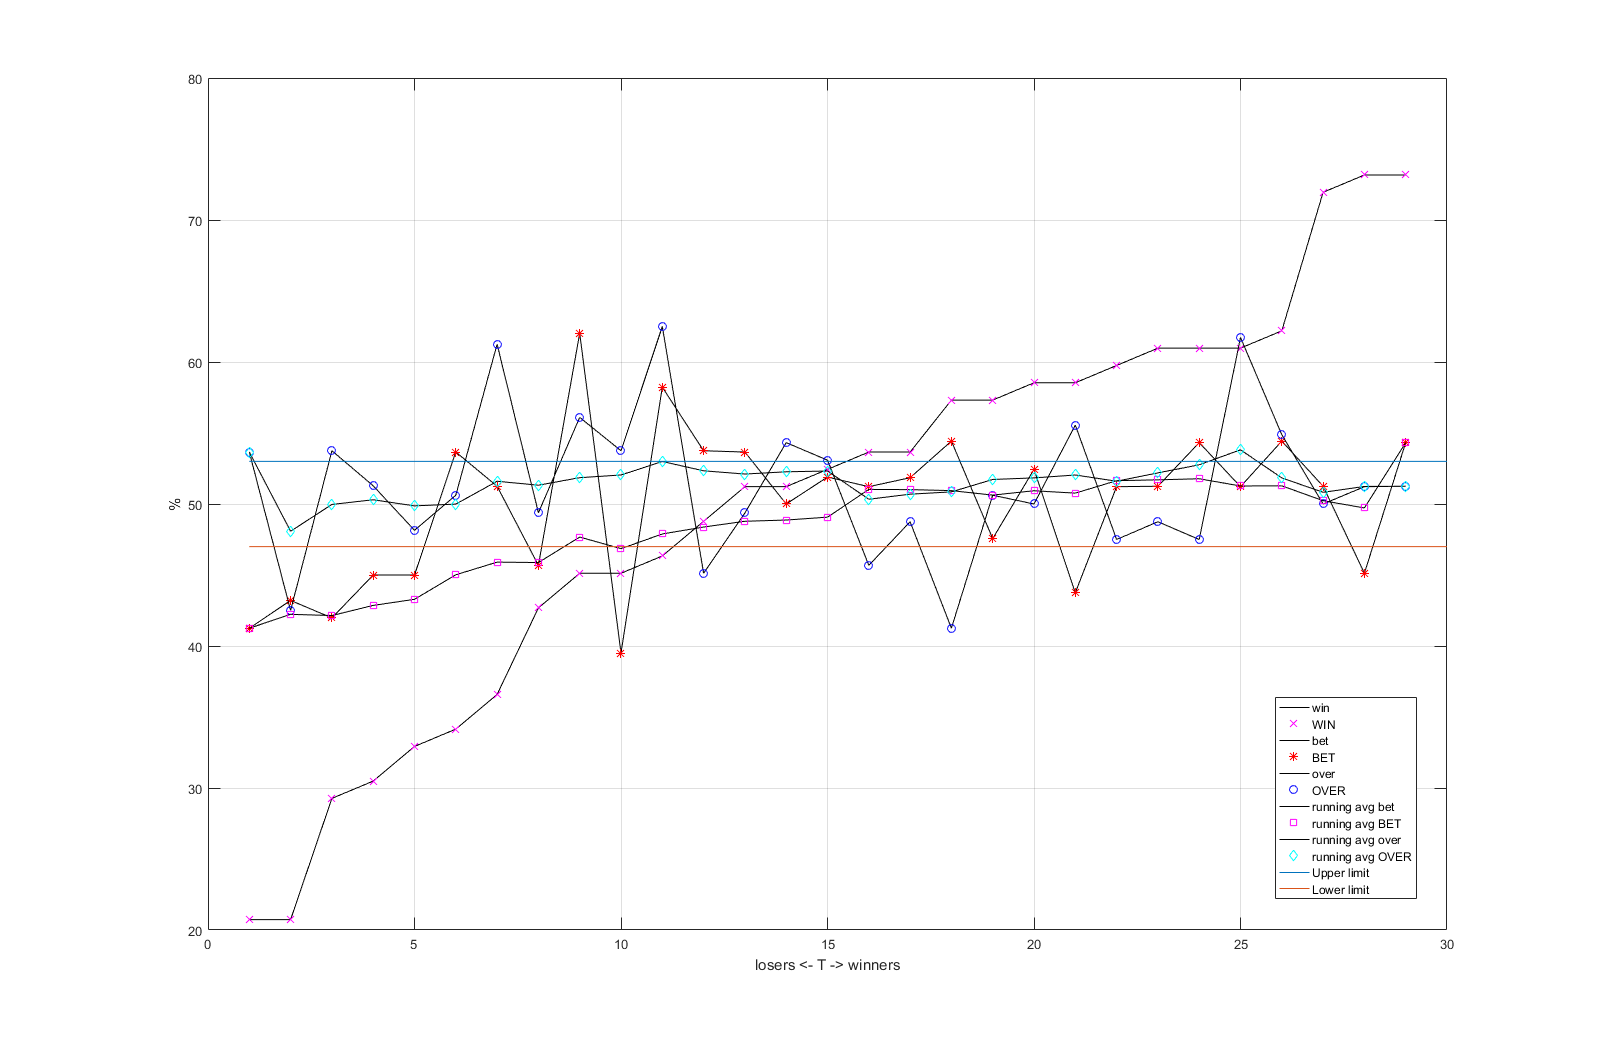
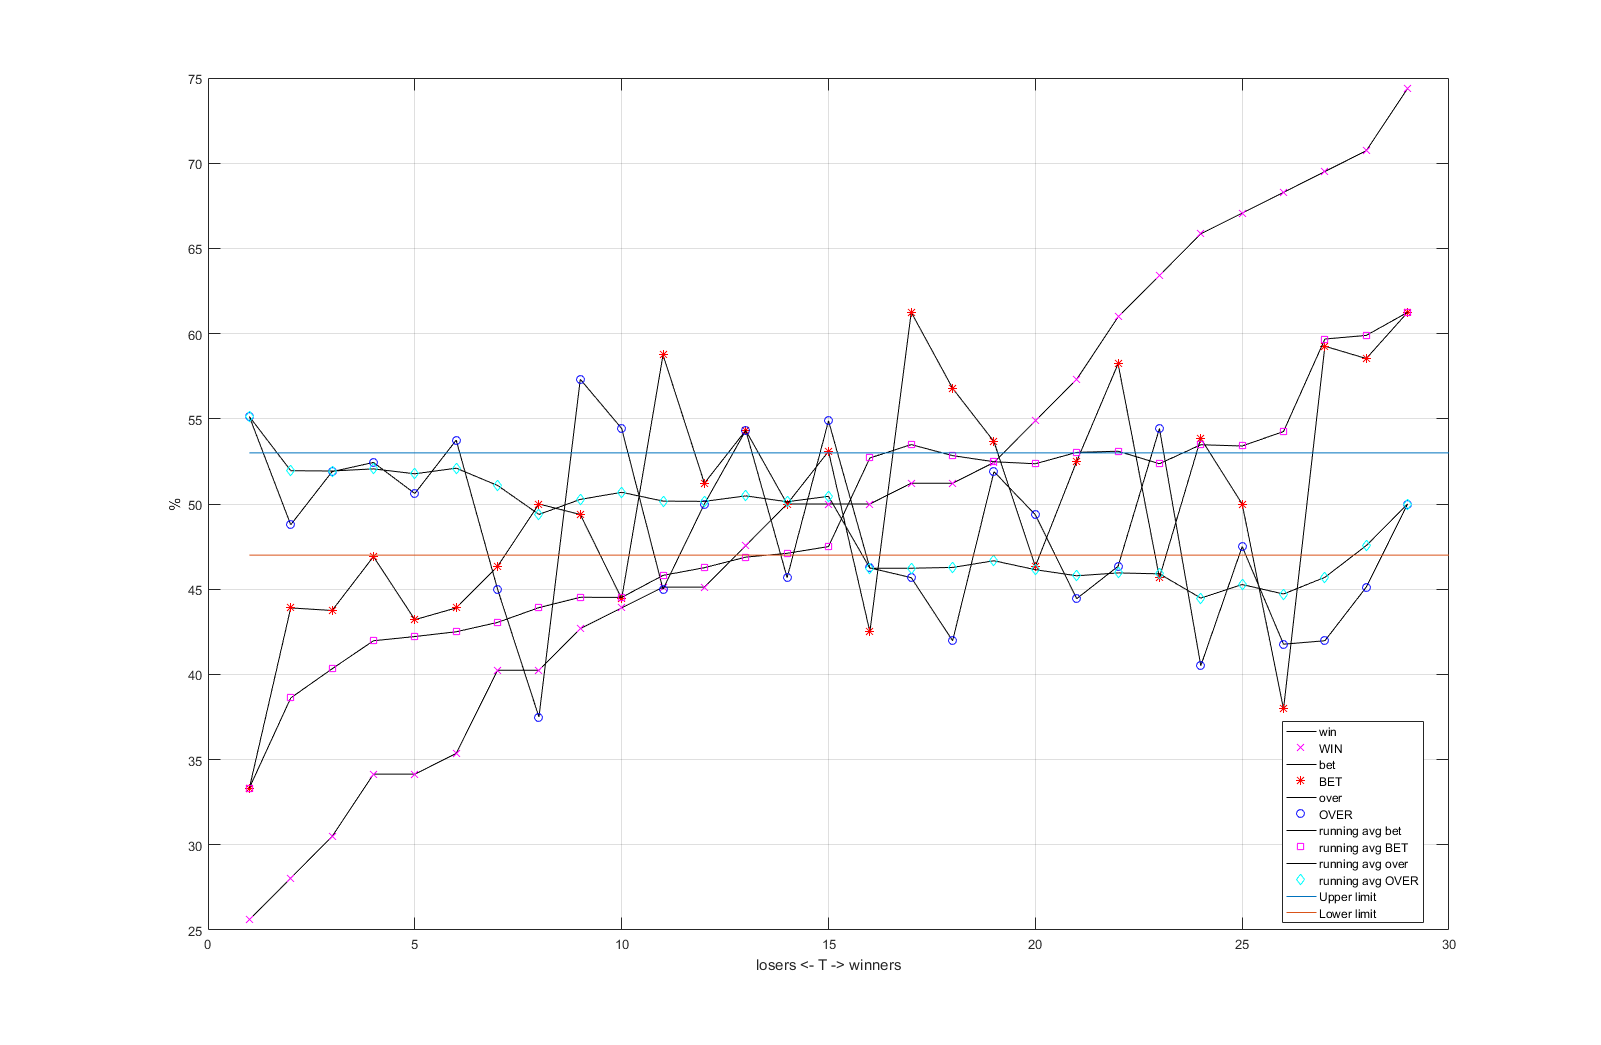
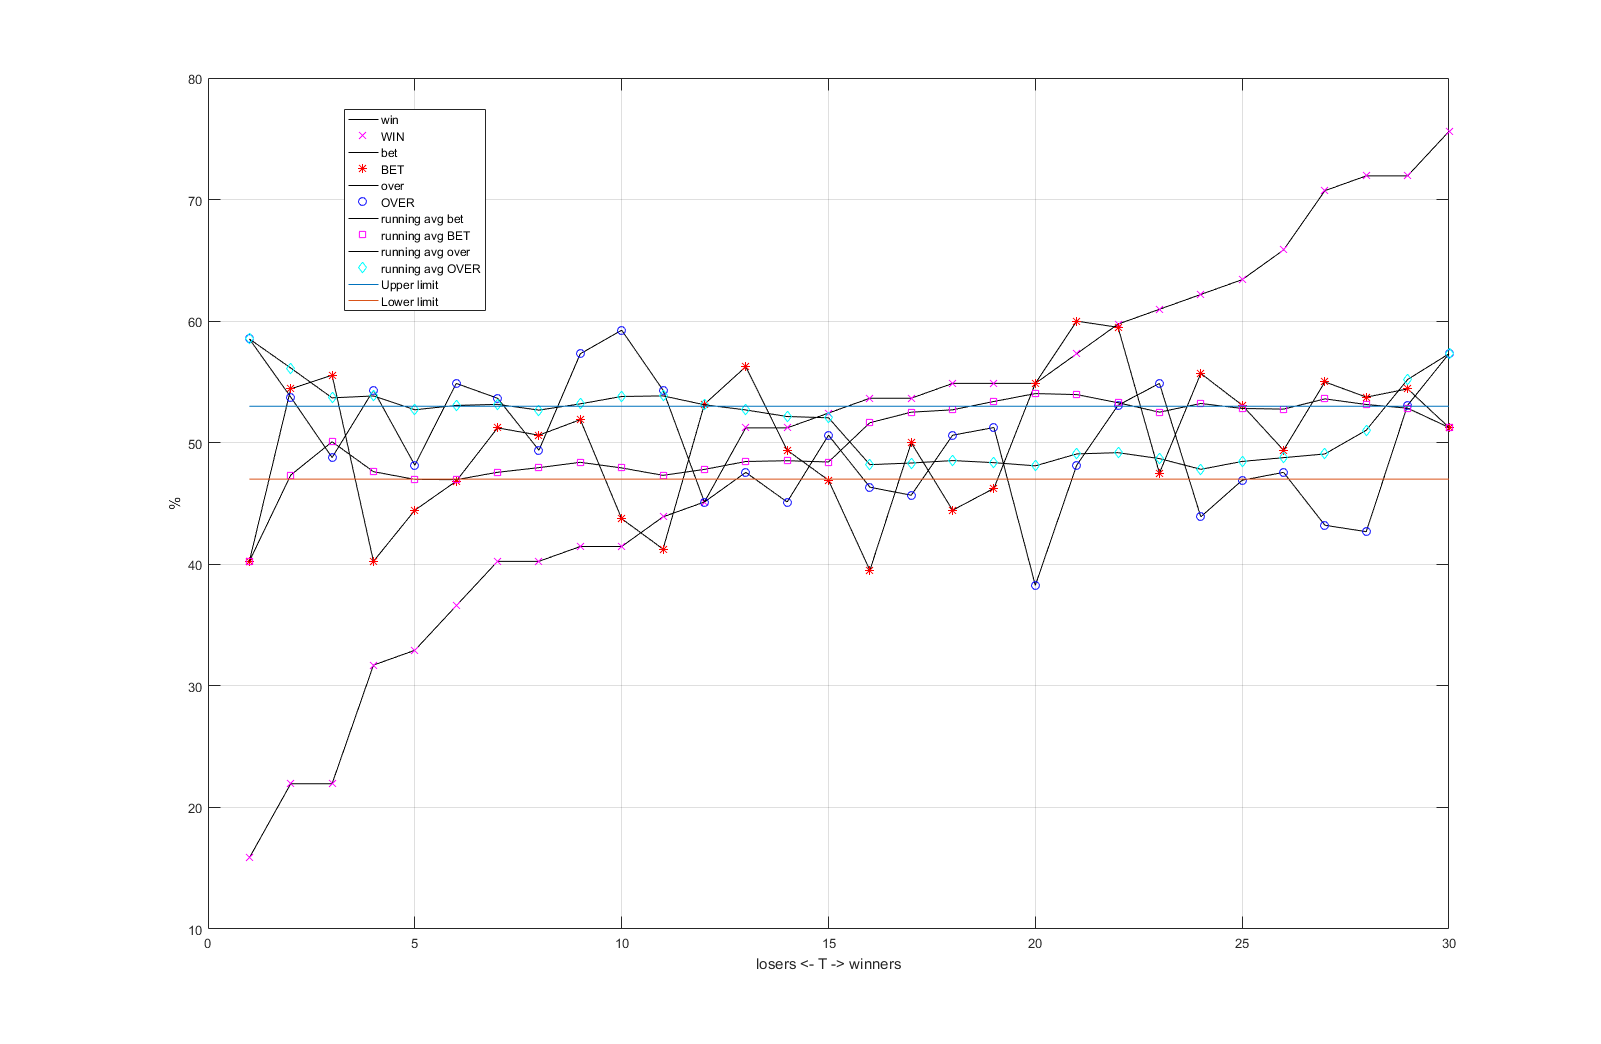
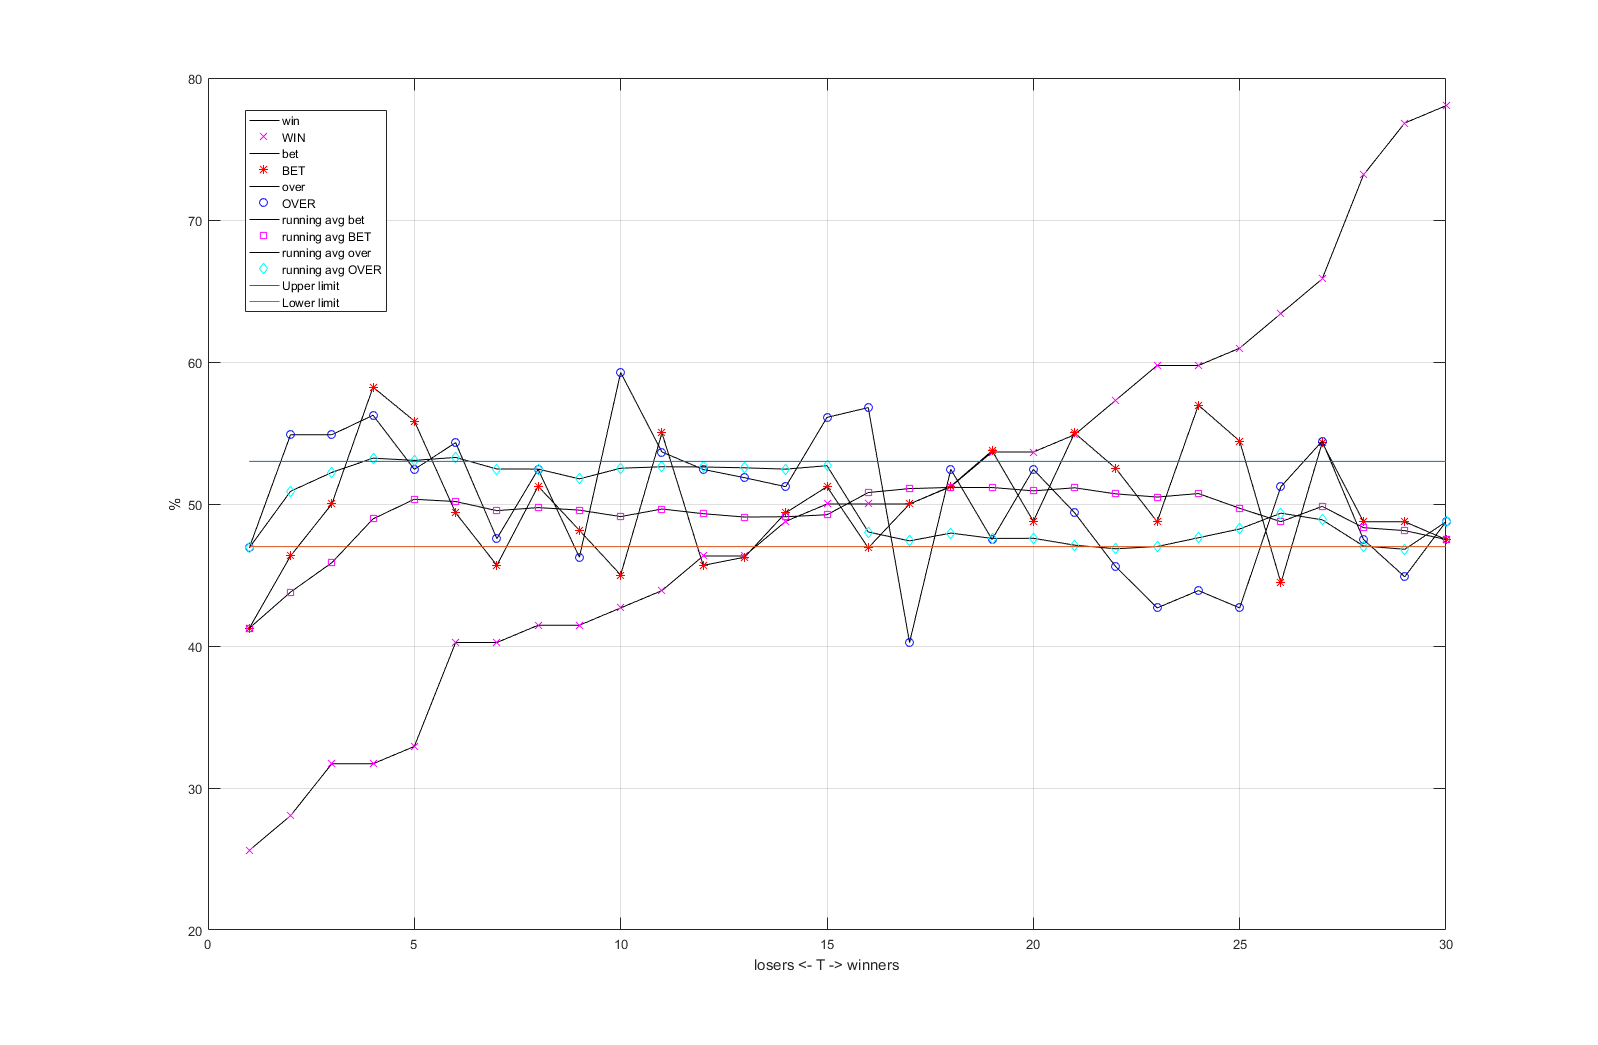
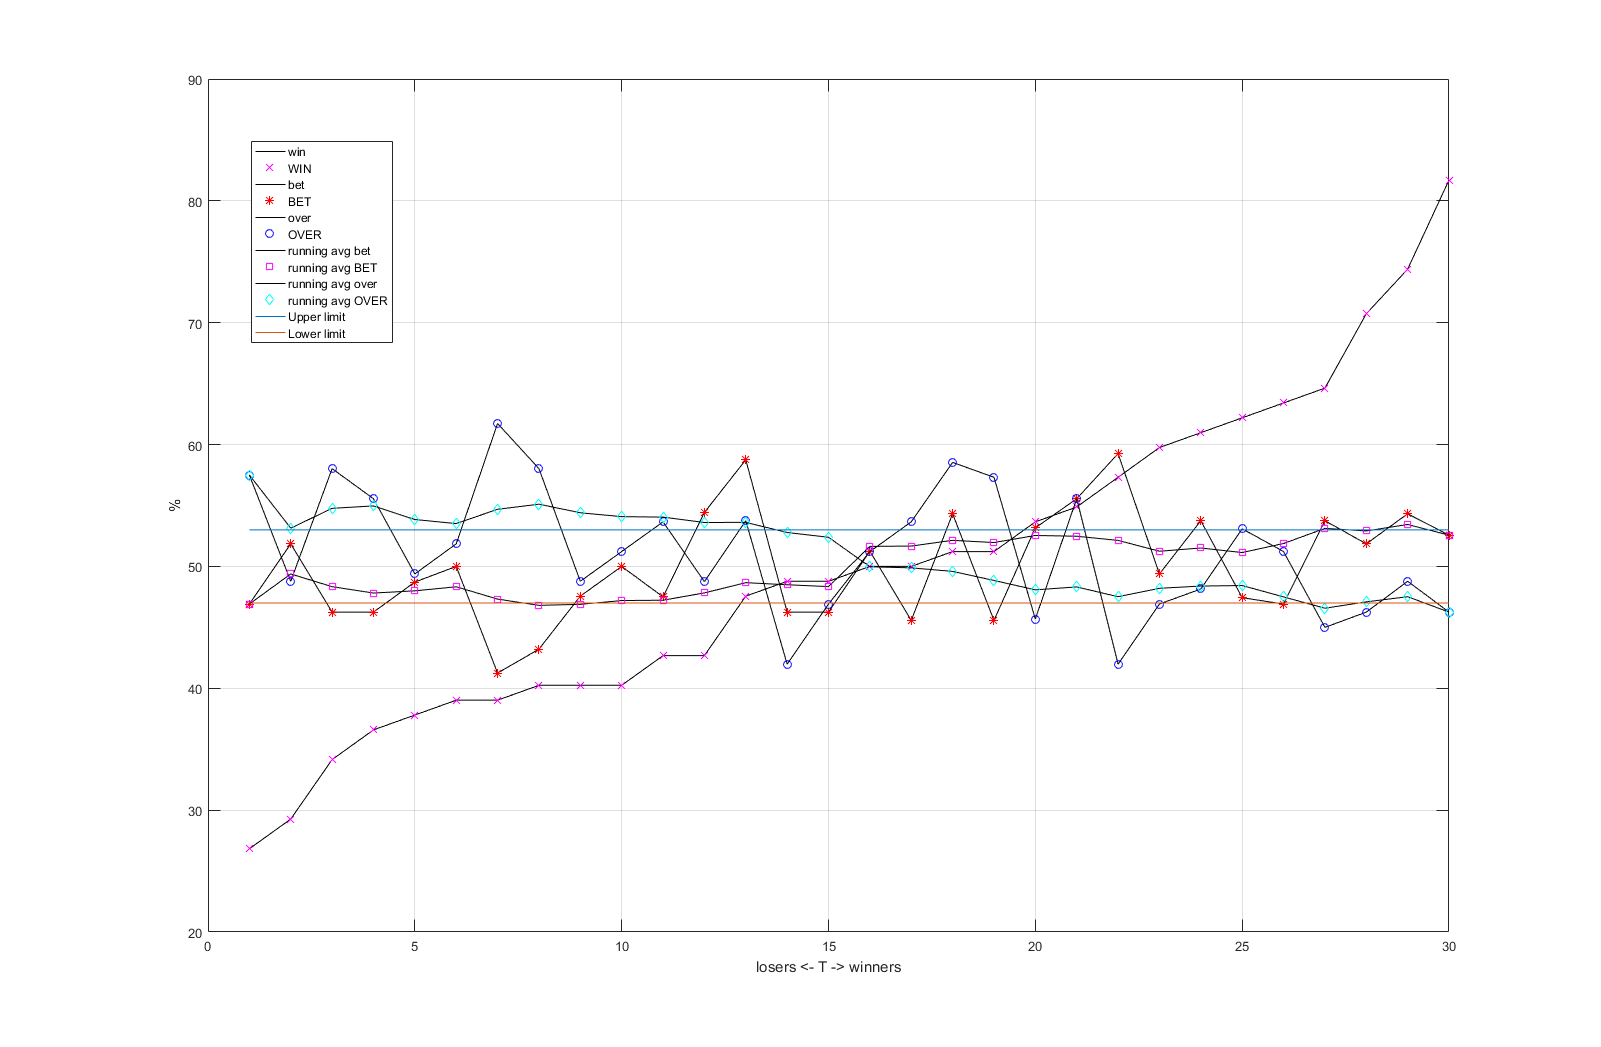
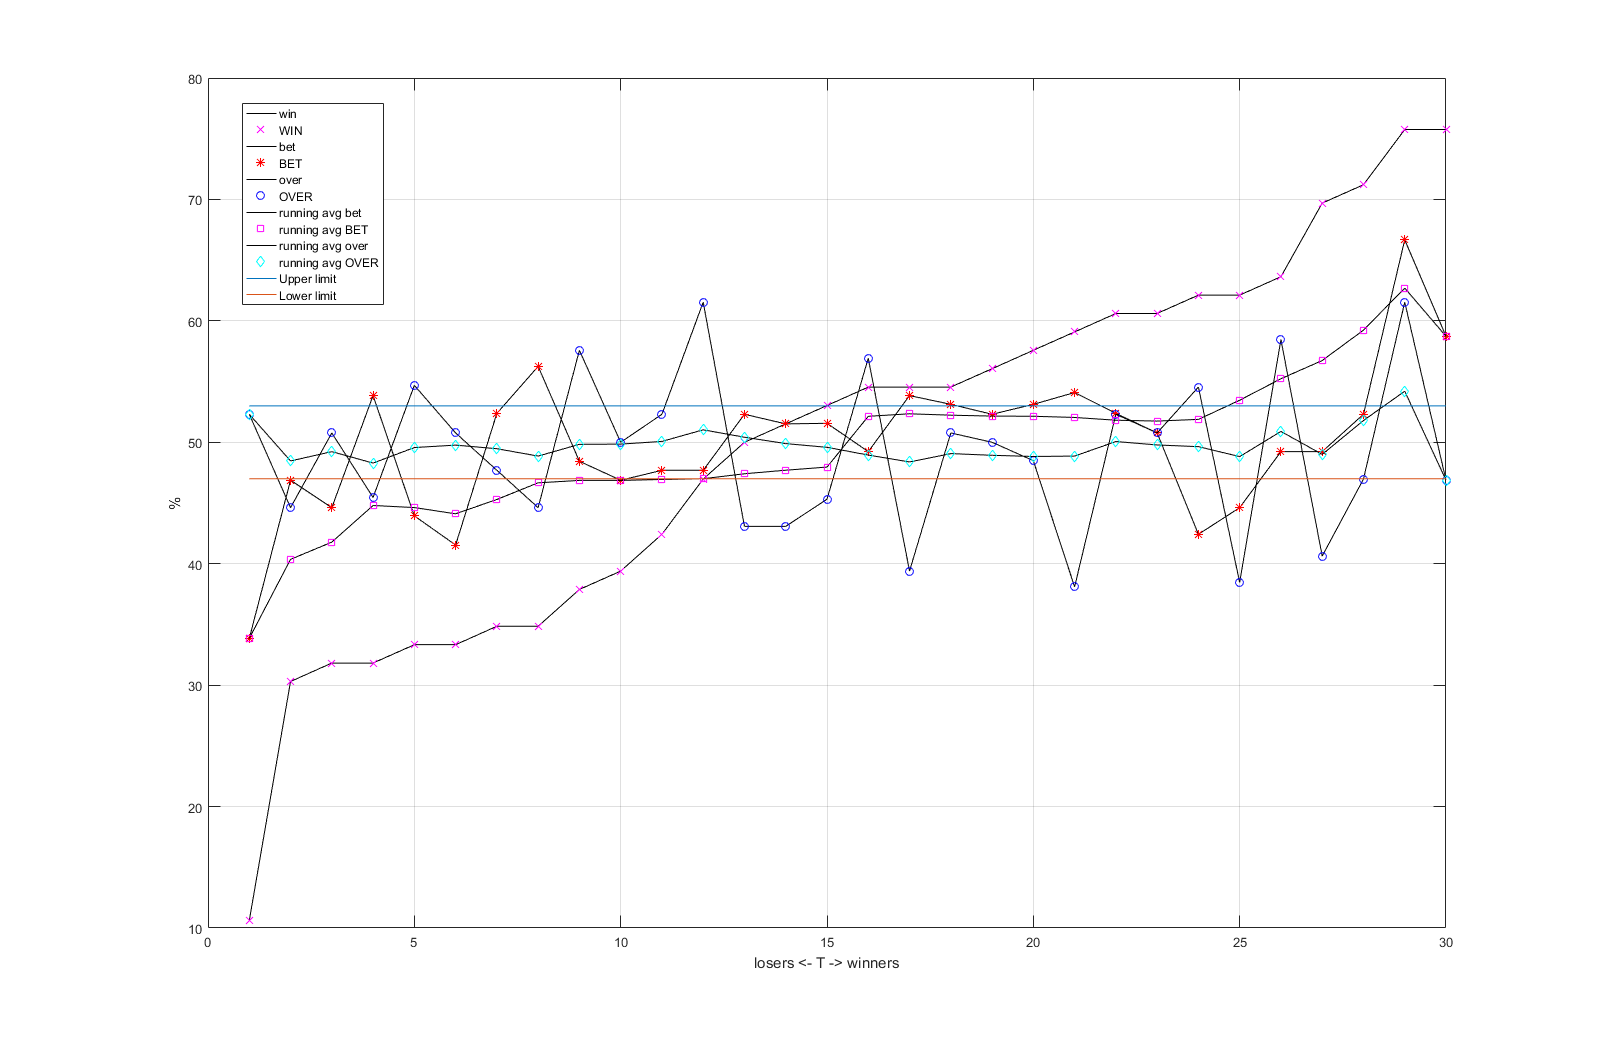
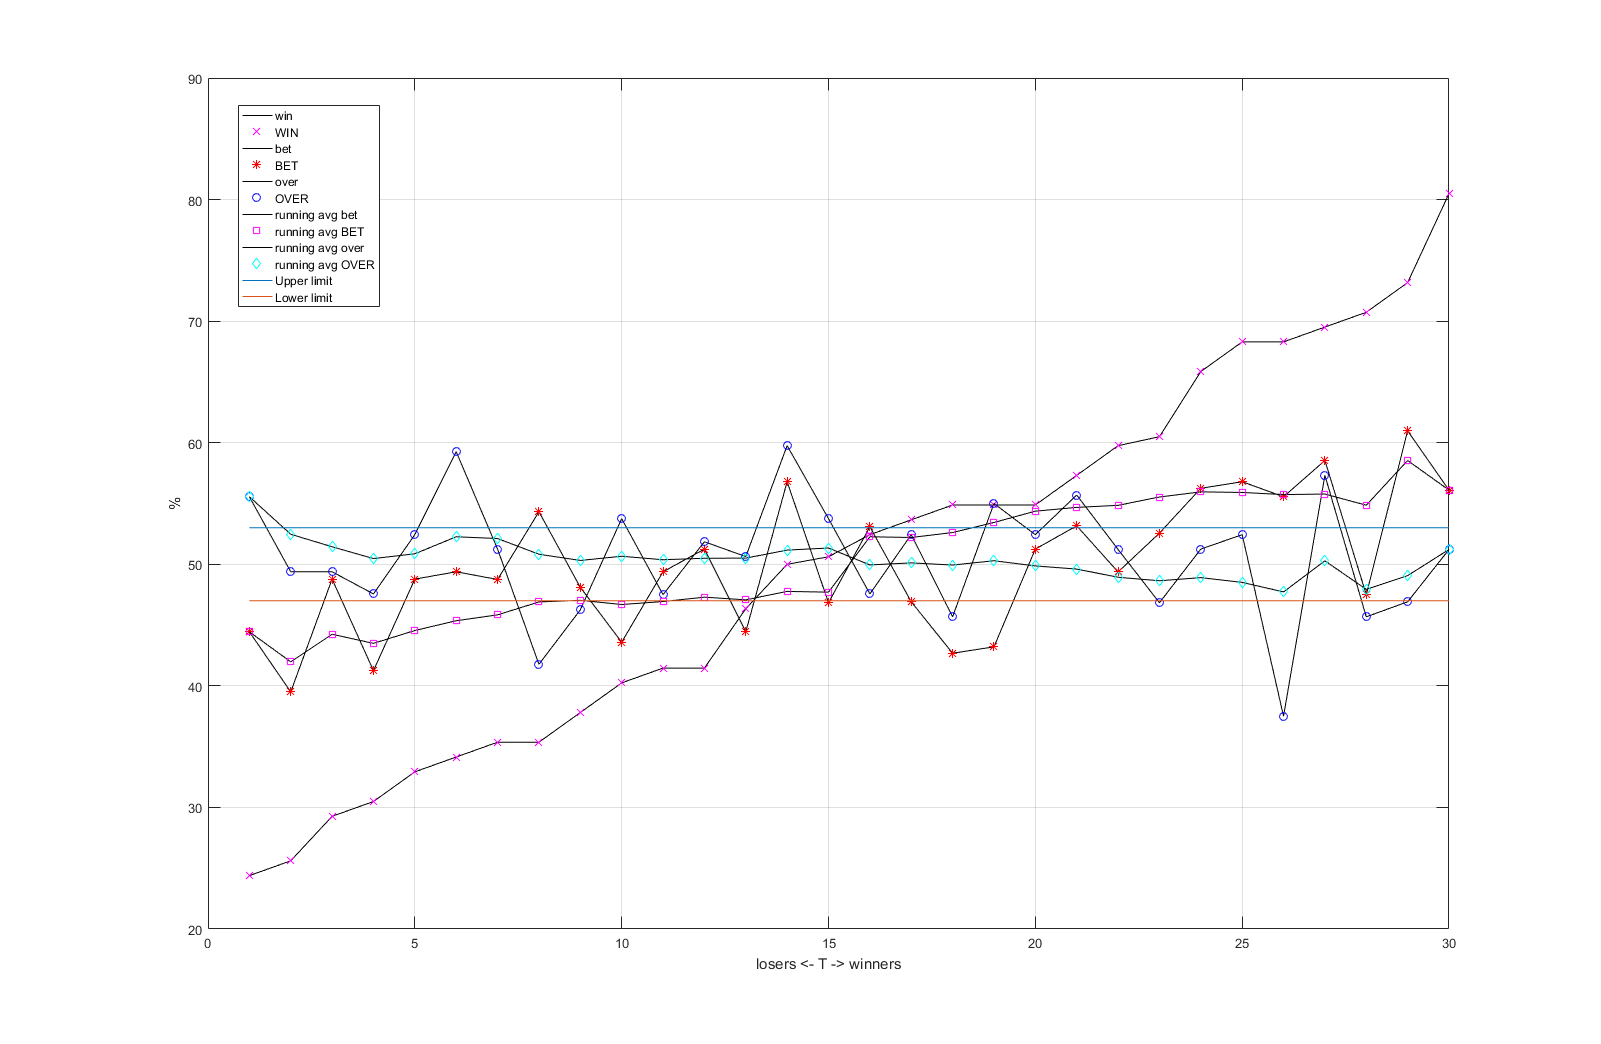
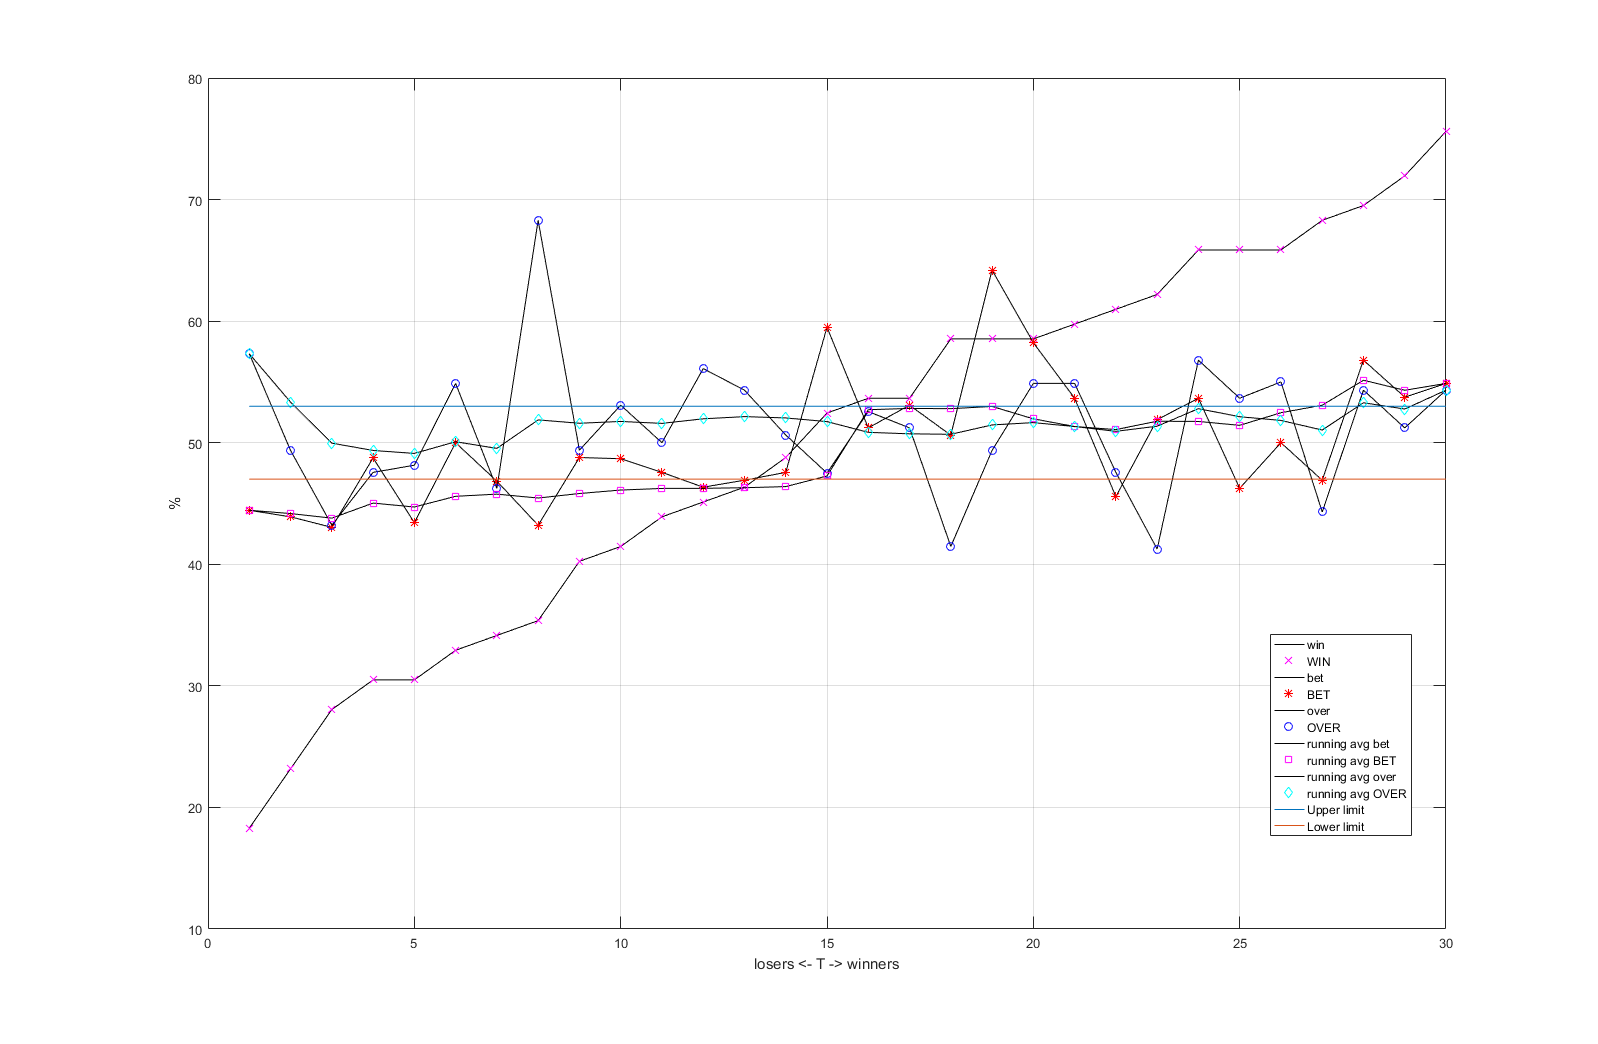
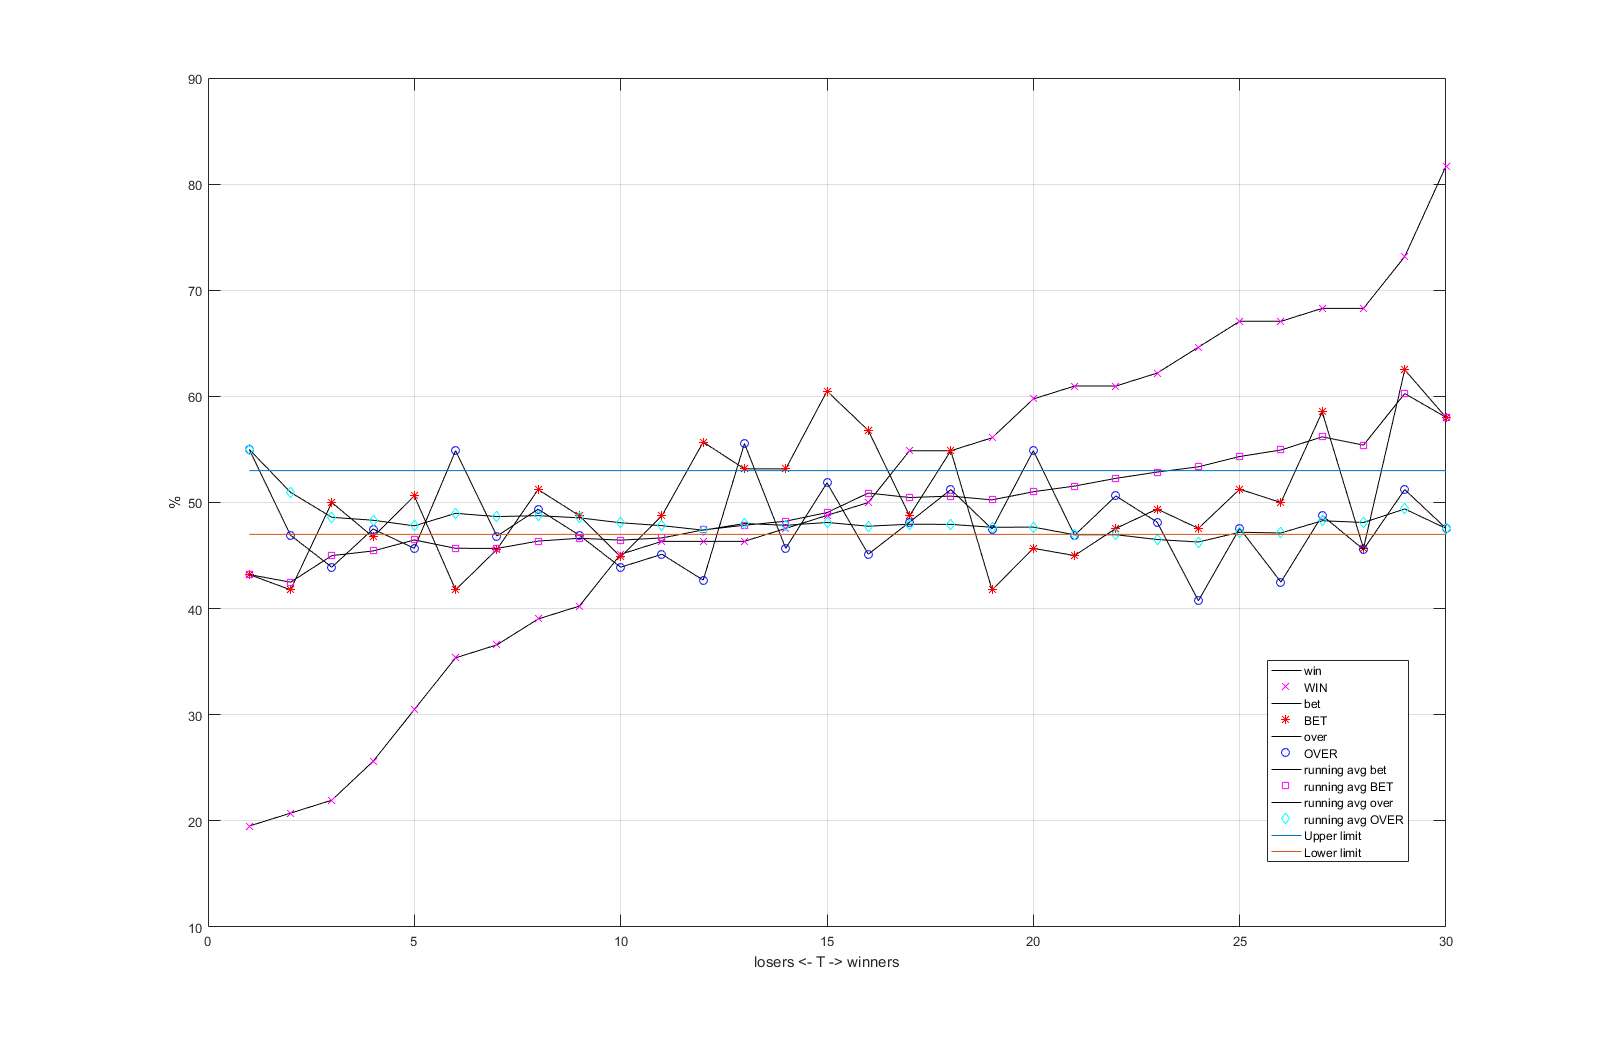
it is easy to notice that selecting who is going to win a game match is easier that selecting who is going to cover the point spread. In the same way, it is easier to select who is going to lose the match that select who is going to no cover the point spread.

In order to use these results in a consistent way, a running average al- gorithm is integrated in the formulation. The objective of the algorithm is to smooth the outlier so they compensate each other while still obtaining a continuos outlier shape in the two ends of the plot. This technique is used in the stock market for defining stocks trends

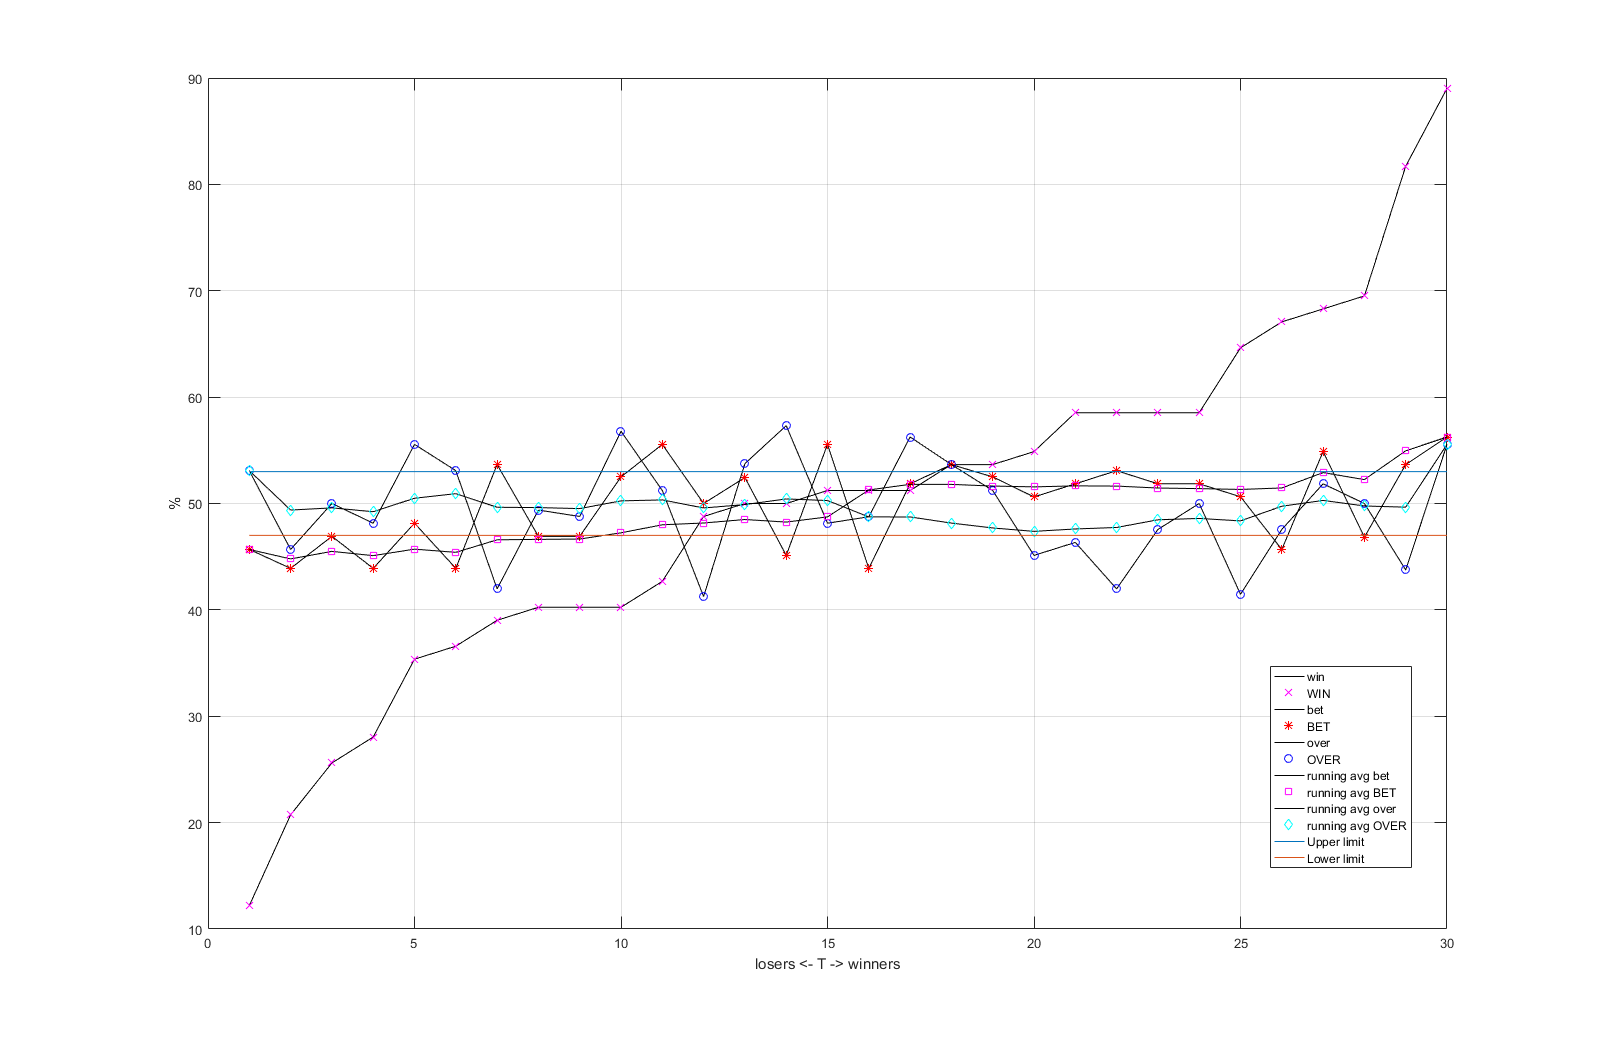
Next are the NBA season plots:

TOP 
BA Seson 1990-1991

TOP 
BA Seson 1991-1992

TOP 
BA Seson 1992-1993

TOP 
BA Seson 1993-1994

TOP 
BA Seson 1994-1995

TOP 
BA Seson 1995-1996

TOP 
BA Seson 1996-1997

TOP 
BA Seson 1997-1998

TOP 
BA Seson 1998-1999

TOP 
BA Seson 1999-2000

TOP 
BA Seson 2000-2001

TOP 
BA Seson 2001-2002

TOP 
BA Seson 2002-2003

TOP 
BA Seson 2003-2004

TOP 
BA Seson 2004-2005

TOP 
BA Seson 2005-2006

TOP 
BA Seson 2006-2007

TOP 
BA Seson 2007-2008

TOP 
BA Seson 2008-2009

TOP 
BA Seson 2009-2010

TOP 
BA Seson 2010-2011

TOP 
BA Seson 2011-2012

TOP 
BA Seson 2012-2013

TOP 
BA Seson 2013-2014

TOP 
BA Seson 2014-2015

TOP 
BA Seson 2015-2016

TOP 
2019 Luis A. Mateos