From the previous section, it is easy to notice that selecting who is going to win a game match is easier that selecting who is going to cover the point spread. In the same way, it is easier to select who is going to lose the match that select who is going to no cover the bet.
In order to use these results in a consistent way, a running average algorithm is integrated in the formulation. The objective of the algorithm is to smooth the outlier so they compensate each other while still obtaining a continuos outlier shape in the two ends of the plot. This technique is used in the stock market for defining stocks trends.
The process is as follows: the sorted winning percentage position of the teams is taken to obtain the covering percentage of that position.
The algorithm is performed on the two outliers. One is for the THwpct teams with high winning percentages
starting on the tHwpct team with the highest winning average,
moving to the second highest and so on until the running
average fails to overcome the house edge of 2.54%
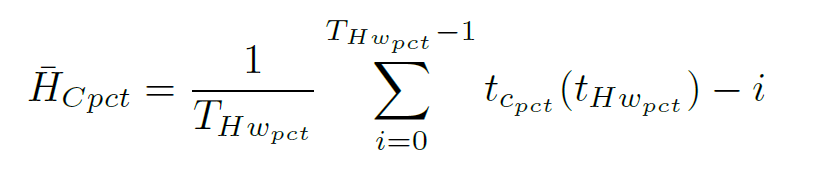
where ![]() Cpct is the value of the running average
for the cover variable with respect to the position from the
teams with high winning percentage and tcpct is the team
covering percentage.
Cpct is the value of the running average
for the cover variable with respect to the position from the
teams with high winning percentage and tcpct is the team
covering percentage.
The second instance of the algorithm is
applied to the TLwpct teams with low winning percentages,
starting on the tlwpct team with the lowest winning percentage
and moving to second lowest and so on until the running
average fails to overcome the house edge where
![]() Npct is the value of the running average for the no
cover variable with respect to the position from the teams
with low winning percentage and tnpct is the team no covering
percentage.
Npct is the value of the running average for the no
cover variable with respect to the position from the teams
with low winning percentage and tnpct is the team no covering
percentage.

Cover the point spread variable
The result from applying the running average algorithm to the first subgroup is shown in the plot below, which includes the 1990-1991 to 1994- 1995 NBA seasons (27 teams). In this subgroup, if selecting the six best teams with winning percentages will lead to overcome the house edge of the 2.54%. If selecting the worst seven winning percentages teams will overcome the house edge too.
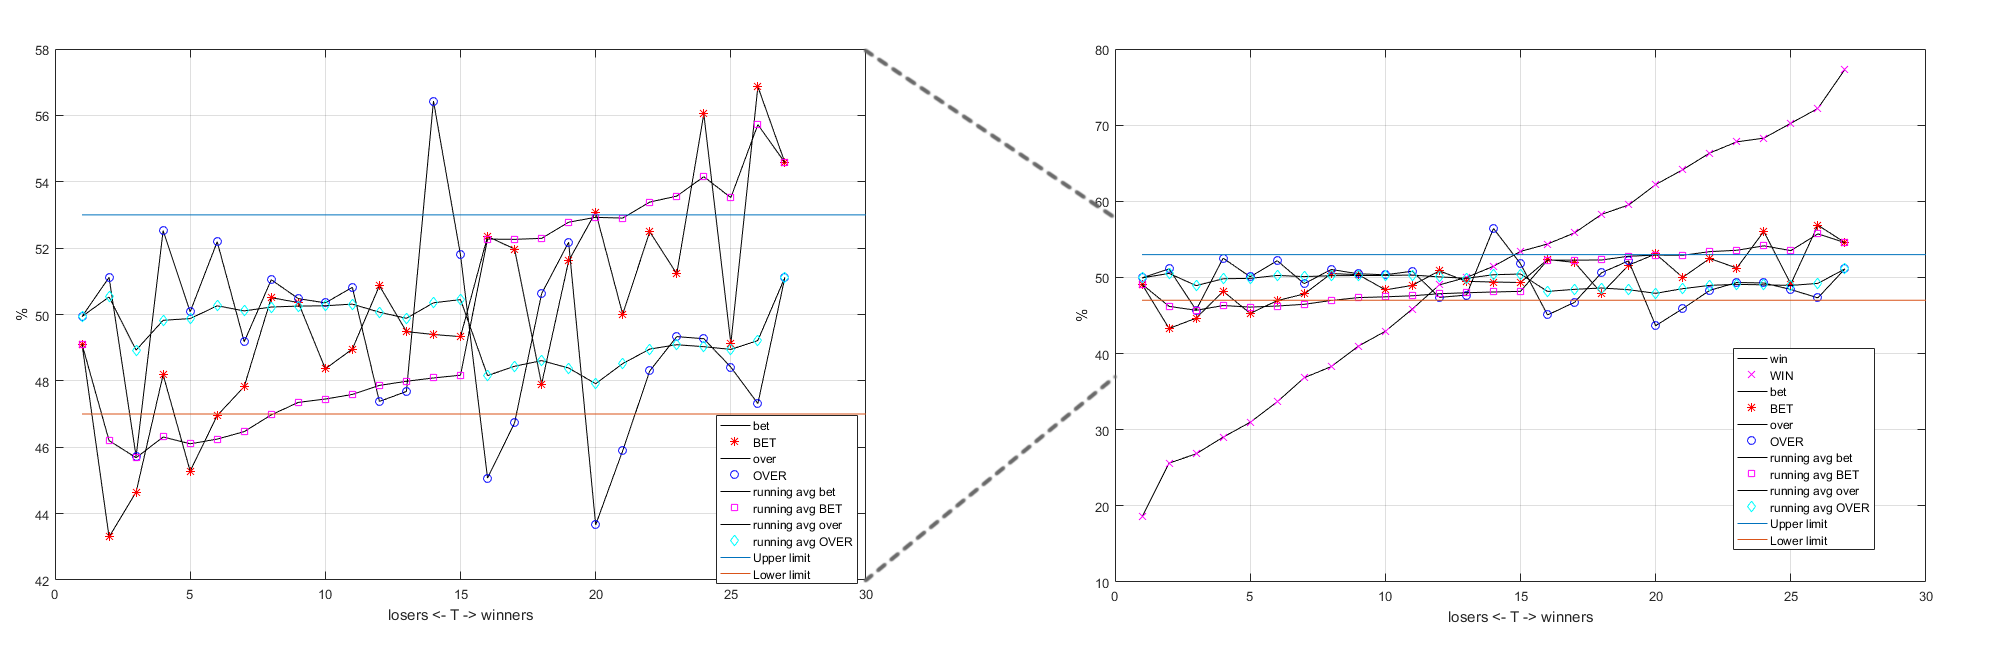
NBA Seasons 1990-1991 to 1994-1995 (27 teams)
The result from applying the moving average algorithm to the second subgroup, which includes the 1995-1996 to 2003-2004 NBA seasons, with 29 teams is hown in the plot below. The result reveal that the seven best teams with winning percentages will surpass the house edge and the eight teams with the lowest winning percentages also surpass the 2.54% threshold.
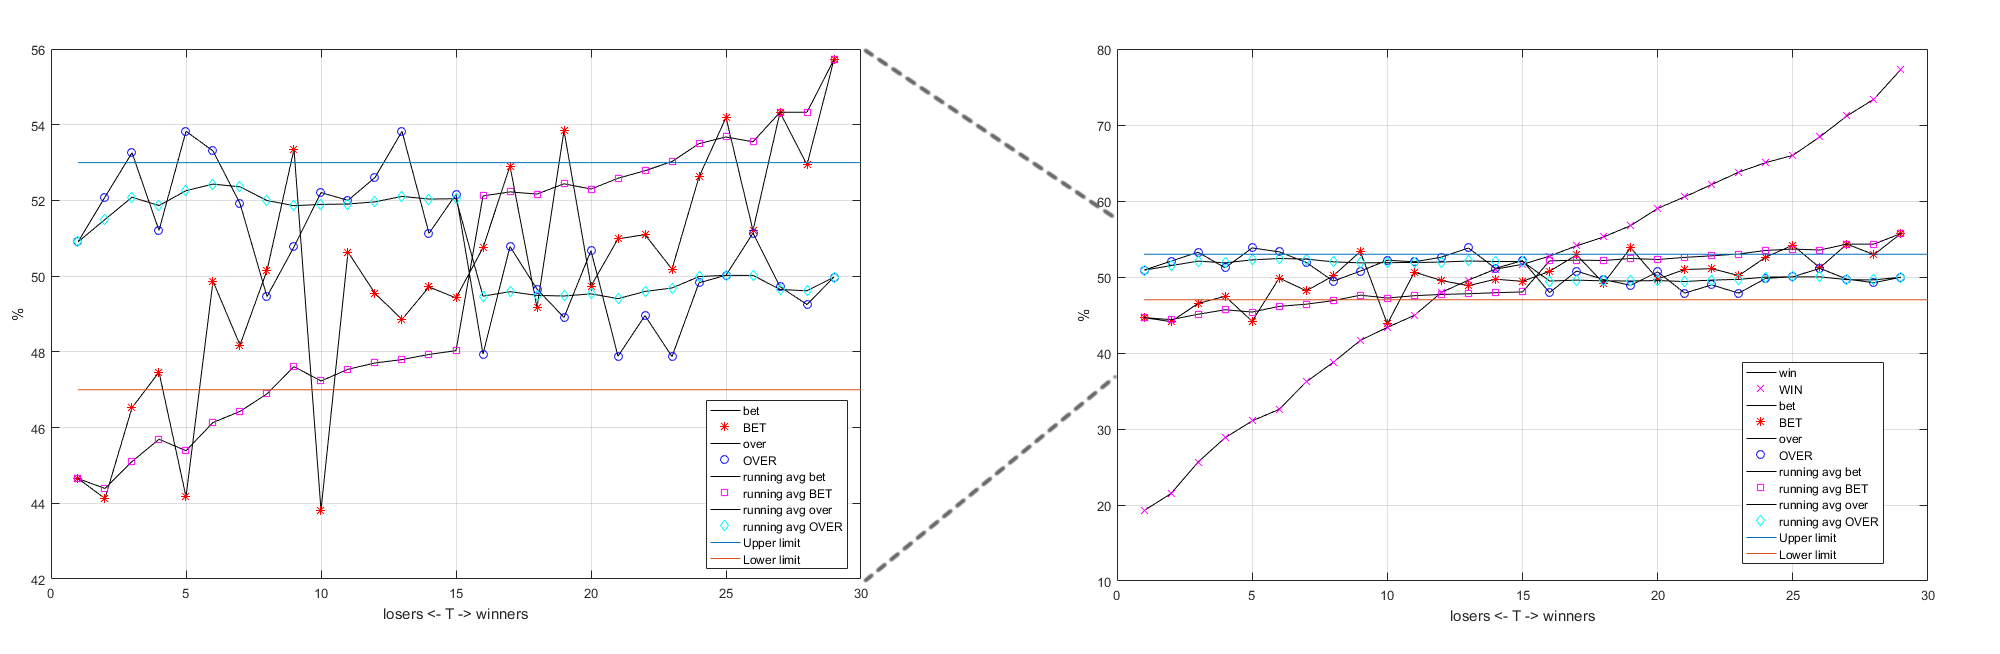
NBA Seasons 1995-1996 to 2003-2004 (29 teams)
In the current era of professional basketball with 30 teams, comprising the 2004-2005 to 2013-2014 NBA seasons, the result from applying the moving average algorithm show that the five teams with highest winning percentages and the ten teams with worst winning percentages surpassed the house edge.
NBA Seasons 2004-2005 to 2013-2014 (30 teams)
Over the total points line (TPL) variable
Applying the running average algorithm to the over the TPL variable results in a plot that remains in the house edge domain. The only notable pattern is a tendency of the THwpct teams with high winning percentages to have an under ≈1.3% of the times more likelly than an over. Also a tendency of the TLwpct teams with low winning percentage to have an over ≈1.2% the times more likelly than an under.
From the regression study in Section ![]() egression together with the
proposed algorithm, a couple of correlation emerged between
the variables W/L↔C/N and W/L↔O/U.
egression together with the
proposed algorithm, a couple of correlation emerged between
the variables W/L↔C/N and W/L↔O/U.
The correlation coefficient assume values in the range from -1 to +1, where +1 indicates the strongest possible agreement and -1 the strongest possible disagreement. This correlation is calculated as the proportion of the extreme outliers from the variables in consideration:
W/L correlation coefficient to C/N is ≈0.2
W/L correlation coefficient to O/U is ≈-0.04
The Player Edge consist in taking groups of teams from the two outliers, one THwpct : Teams with high winning percentages and the second for the TLwpct : Teams with low winning percentages.
The following table show the TLwpct as the twelve low winning percentages teams to surpass the casino’s edge.
| NO COVER the point spread | Casino Vigorish "Juice" -2.4% for -110 |
Profit | |
| The most losing team NO COVER the bets | 44.68% | -2.4% | 2.92% |
| The 2 most losing teams COVER the bets | 44.76% | -2.4% | 2.84% |
| The 3 most losing teams COVER the bets | 45.34% | -2.4% | 2.26% |
| The 4 most losing teams COVER the bets | 45.95% | -2.4% | 1.65% |
| The 5 most losing teams COVER the bets | 45.88% | -2.4% | 1.72% |
| The 6 most losing teams NO COVER the bets | 46.19% | -2.4% | 1.41% |
| The 7 most losing teams NO COVER the bets | 46.42% | -2.4% | 1.18% |
| The 8 most losing teams NO COVER the bets | 46.86% | -2.4% | 0.74% |
| The 9 most losing teams NO COVER the bets | 47.22% | -2.4% | 0.38% |
| The 10 most losing teams NO COVER the bets | 47.13% | -2.4% | 0.47% |
| The 11 most losing teams NO COVER the bets | 47.31% | -2.4% | 0.29% |
| The 12 most losing teams NO COVER the bets | 47.54% | -2.4% | 0.06% |
Less winning teams in NBA seasons 1990-1991 to 2013-2014
In the same way, the next table shows the THwpct as the twelve high winning percentages teams to surpass the casino’s edge with the proposed Player Edge. Moreover, the summation of percentages reveal that it is a better option to bet to the TLwpct teams with low winning percentage to no cover the bet with a culmulative percentage of 15.92% compared to the THwpct with 13.35% to cover the bet.
| COVER the point spread | Casino Vigorish "Juice" -2.4% for -110 |
Profit | |
| The most winning team COVER the bets | 55.48% | -2.4% | 3.08% |
| The 2 most winning teams COVER the bets | 55.27% | -2.4% | 2.87% |
| The 3 most winning teams COVER the bets | 54.23% | -2.4% | 1.83% |
| The 4 most winning teams COVER the bets | 53.96% | -2.4% | 1.56% |
| The 5 most winning teams COVER the bets | 53.62% | -2.4% | 1.22% |
| The 6 most winning teams COVER the bets | 53.23% | -2.4% | 0.83% |
| The 7 most winning teams COVER the bets | 53.08% | -2.4% | 0.68% |
| The 8 most winning teams COVER the bets | 52.86% | -2.4% | 0.46% |
| The 9 most winning teams COVER the bets | 52.85% | -2.4% | 0.45% |
| The 10 most winning teams COVER the bets | 52.57% | -2.4% | 0.17% |
| The 11 most winning teams COVER the bets | 52.59% | -2.4% | 0.19% |
| The 12 most winning teams COVER the bets | 52.41% | -2.4% | 0.01% |
Most winning teams in NBA seasons 1990-1991 to 2013-2014
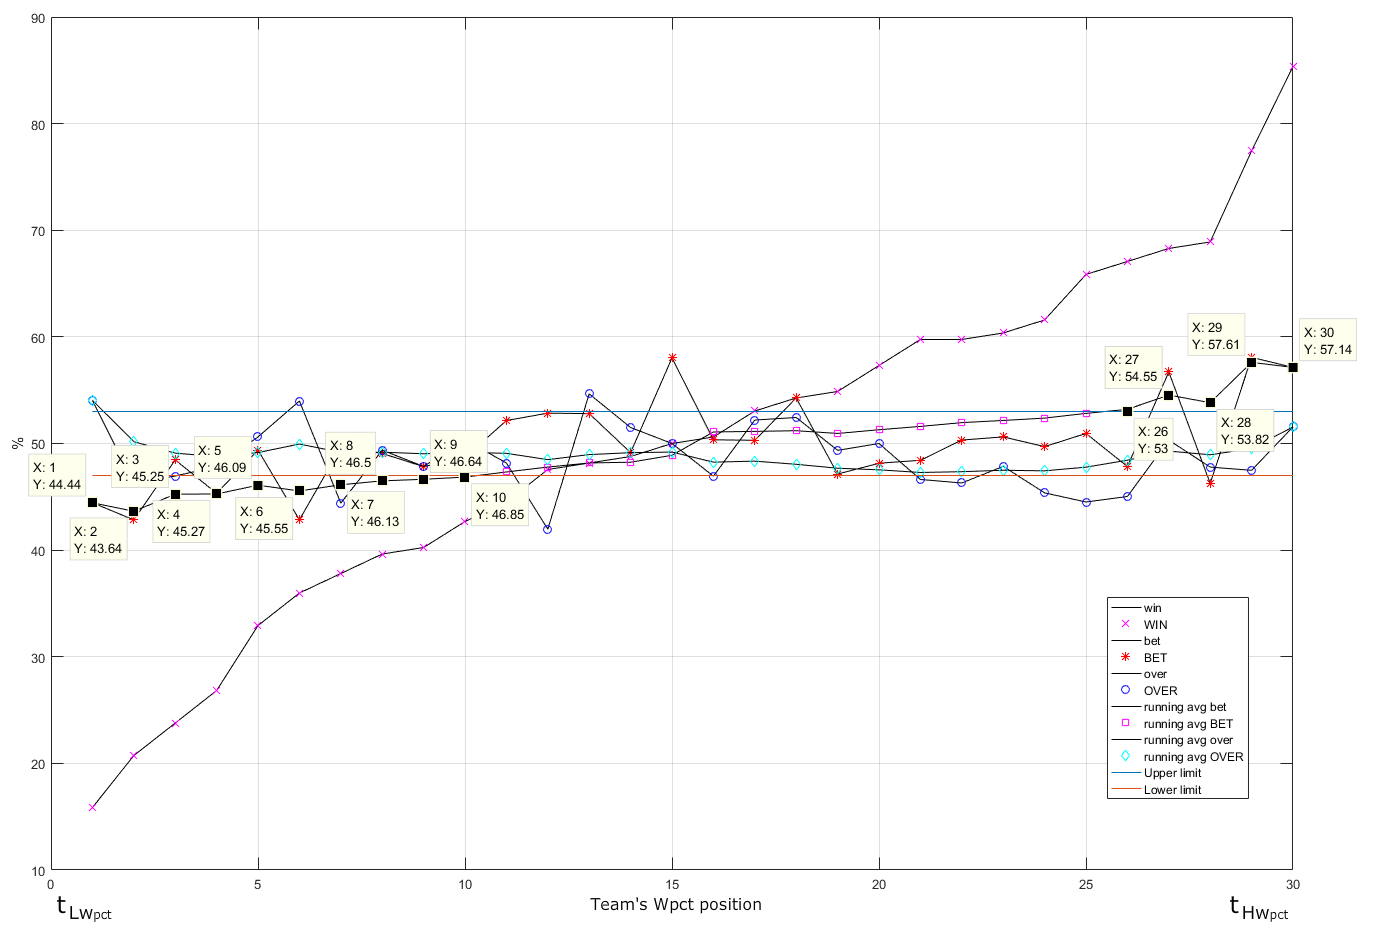
The complete study for the 24 NBA season (1990-1991 to 2013-2014) is shown in the plot below, THwpct : Teams with high winning percentages as the best twelve teams with the highest winning percentage to cover the point spread. and TLwpct : Teams with low winning percentages as the best twelve teams with the lowest winning percentage to fail to cover the point spread. The groups are defined untill the running average algorithm falls in the house edge range of 50±2:54%.
Running average from the teams with worst winning percentage tLwpct and for the with the higest winning teams tHwpct, showing a covering percentage for the twelve less winning teams that overcomes the house edge of -2.54%. And for the twelve most winning teams that overcomes the house edge of +2.54%
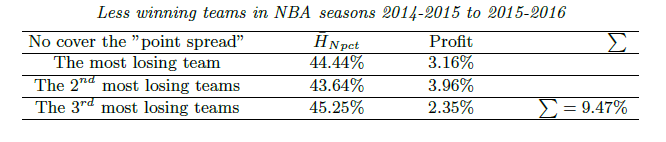
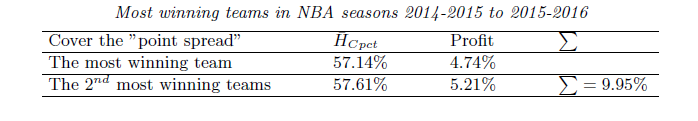
From the "training set" results, let's define a threshold of profit > 2% to test the Player Edge strategy. In this sense, the three teams with the lowest winning percentages and the two teams with the highest are considered in the strategy, see previous tables.
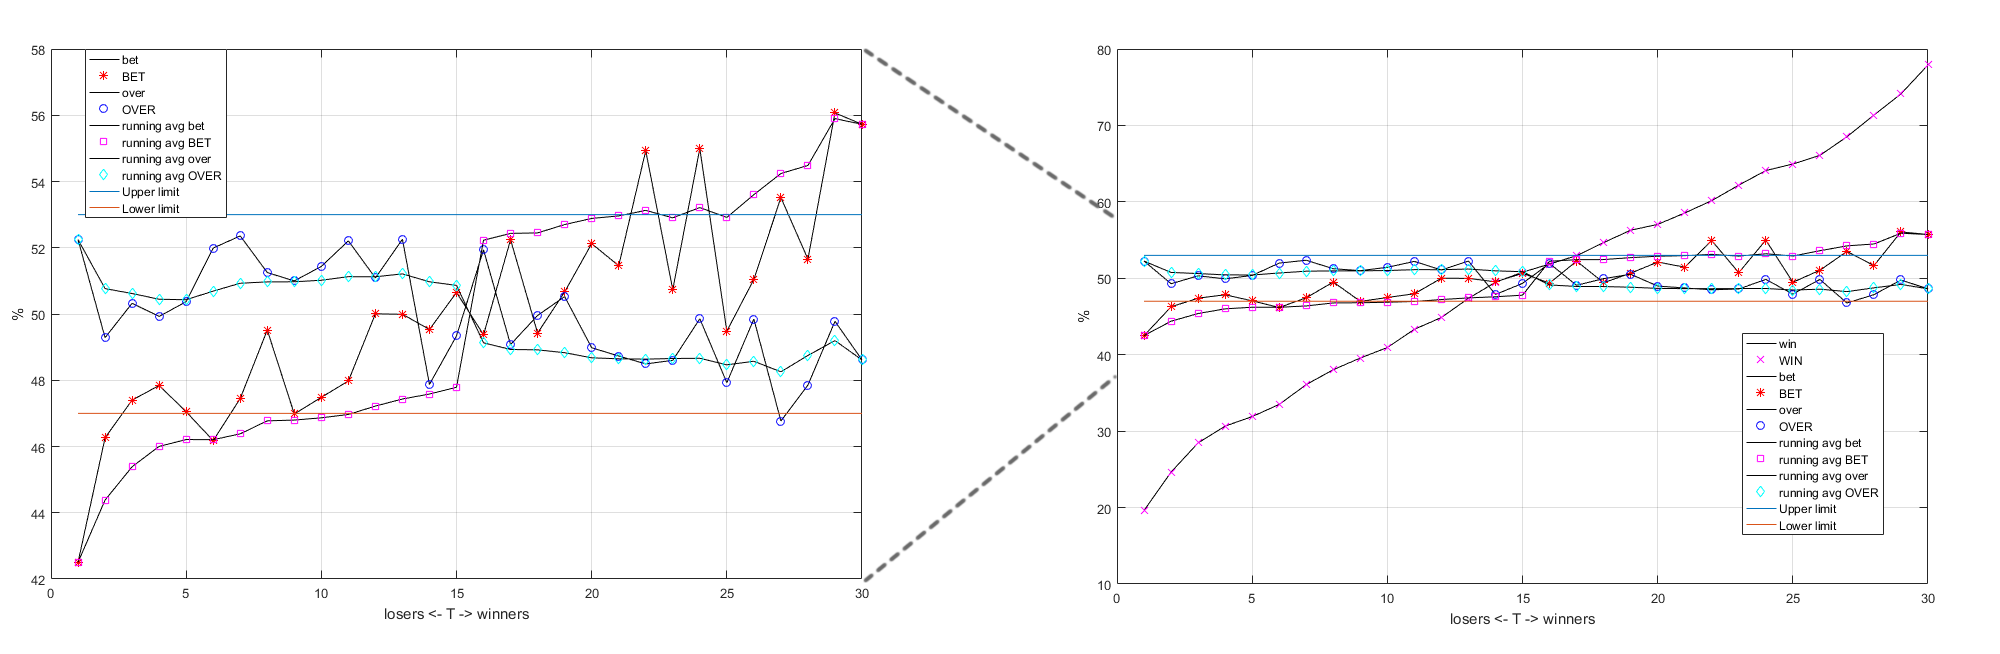
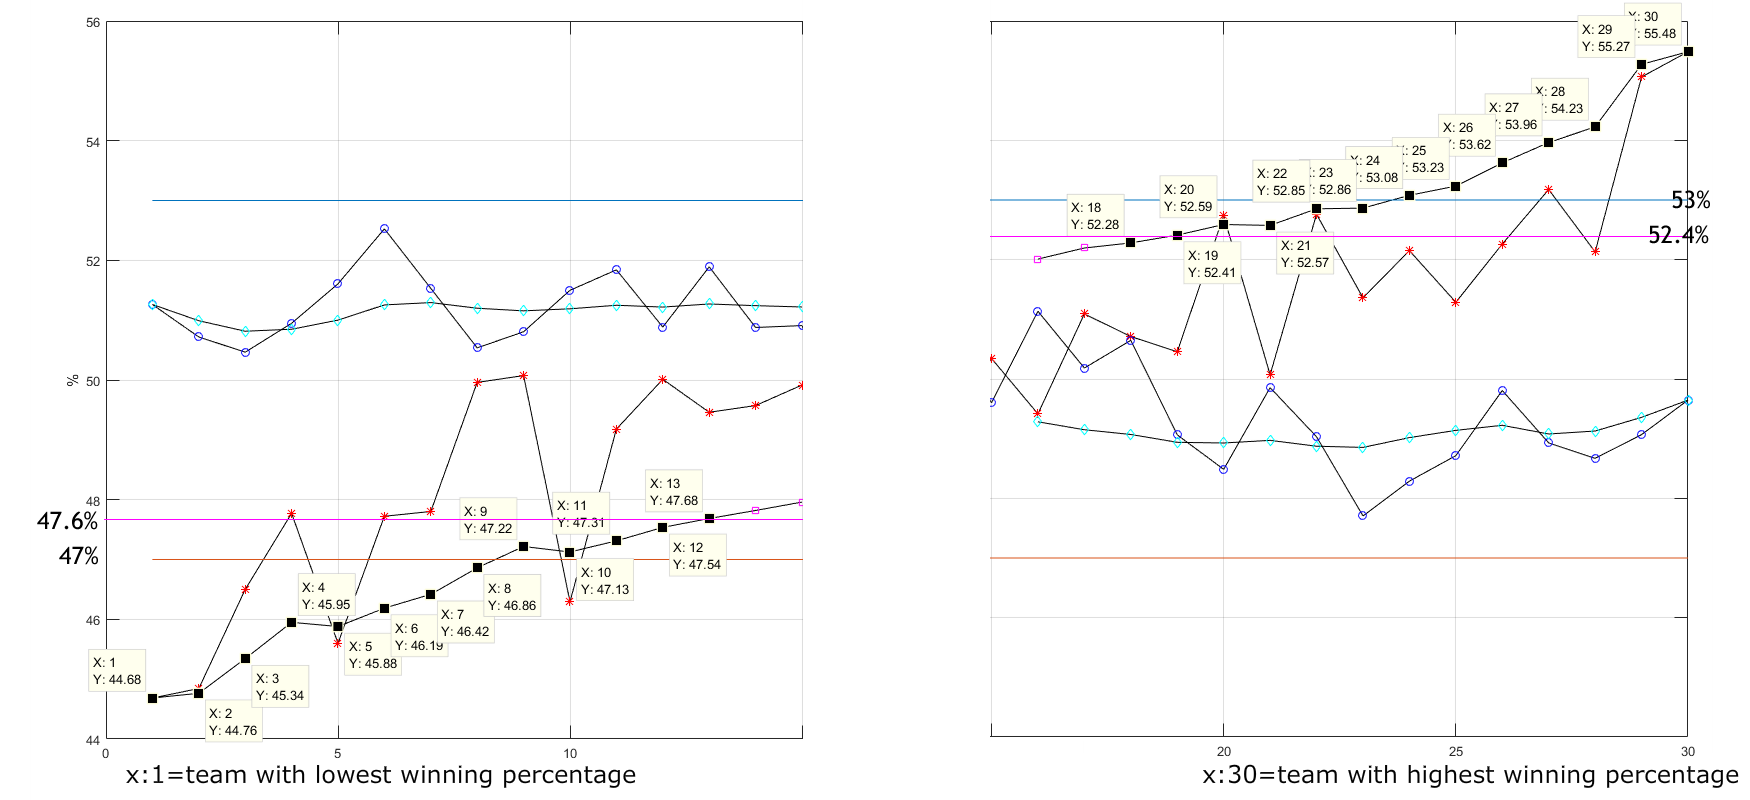
In order to test the performance of the proposed Player Edge strategy, the NBA 2014-2015 and 2015-2016 seasons are used as "test set". The data from applying the Player Edge algorithm, results in profits for the selected range. The next Figure shows the Player Edge algorithm until it converges on the two ends. For the TLwpct teams with lowest winning percentages the worst ten team's percentages surpassed the house edge, while for the THwpct teams with higher winning percentages, only the five most winning team's percentages surpassed the house edge on the positive end. In the Appendix website a detailed information of the Player Edge algortihm applied to each NBA season can be found.
Player edge algorithm highligthing team positions that surpassed the house edge for the NBA seasons 2014-2015 and 2015-2016 used as "test set"
This study aims to answer the question: Does the winning team always covers the bet? in professional basketball NBA.
In order to answer the question, the SPXS - Sports Picks eXpert System is used for performing the regression analysis of all the NBA game matches in regular season, from the 1990-1991 to 2015-2016 season. This dataset is divided and analyzed in two subsets similar to the machine learning - supervised data mining algorithms:A "training set" with the NBA seasons from 1990-1991 to 2013-2014 is used for revealing an indirect factor analysis within the betting variables: cover the point spread to the team's winning percentage position.
A "test set" with the NBA seasons 2014-2015 to 2015-2016 is used for corroborating the hypothetical indirect factor analysis between betting variables.
Also, a Player Edge algorithm and strategy is described, showing a methodology for a possible long-term advantage to the player to surpass the house edge of 2.54%
Moreover, the presented indirect factor analysis can be applied to stock market for defining stocks trends from indirect generalized variables and also for DNA analysis to relate patterns from the indirect generalization of well defined variables.